https://github.com/matt-dray/earl18-crosstalk
:round_pushpin::negative_squared_cross_mark: Demo: {crosstalk} materials for a talk at EARL London 2018
https://github.com/matt-dray/earl18-crosstalk
crosstalk earl flexdashboard leaflet maps rstats schools shiny
Last synced: 5 months ago
JSON representation
:round_pushpin::negative_squared_cross_mark: Demo: {crosstalk} materials for a talk at EARL London 2018
- Host: GitHub
- URL: https://github.com/matt-dray/earl18-crosstalk
- Owner: matt-dray
- Created: 2018-07-31T08:21:02.000Z (almost 8 years ago)
- Default Branch: master
- Last Pushed: 2019-12-10T18:50:38.000Z (over 6 years ago)
- Last Synced: 2025-03-27T04:38:16.960Z (about 1 year ago)
- Topics: crosstalk, earl, flexdashboard, leaflet, maps, rstats, schools, shiny
- Language: HTML
- Homepage: https://matt-dray.github.io/earl18-crosstalk/04_leaflet-flexdash-dt-crosstalk.html
- Size: 5.6 MB
- Stars: 21
- Watchers: 1
- Forks: 8
- Open Issues: 0
-
Metadata Files:
- Readme: README.md
Awesome Lists containing this project
README
# earl18-crosstalk
[](https://www.rostrum.blog/2018/09/12/crosstalk-memes/)
## tl;dr
* [See the full demo of `crosstalk` with `leaflet` and `DT` in a `flexdashboard`](https://matt-dray.github.io/earl18-crosstalk/04_leaflet-flexdash-dt-crosstalk.html) (see the 'Stages of development' section below for the intermediate demos)
* [See my EARL 2018 presentation for which these the demos were used](https://matt-dray.github.io/earl18-presentation/) or access its [source code](https://github.com/matt-dray/earl18-presentation)
* [Read a blog post about the presentation](https://www.rostrum.blog/2018/09/12/crosstalk-memes/)
* [I did an 'advent of memes' on Twitter leading up to the talk; I know that's why you're really here](https://github.com/matt-dray/earl18-presentation/blob/master/memes/links.md)
## Summary
This repo contains code for some materials I used in a presentation at the [EARL (Enterprise Applications of the R Language) conference](https://earlconf.com/) in London on 12 September 2018.
The presentation was about use of [Joe Cheng](https://twitter.com/jcheng)'s [`crosstalk` package](http://rstudio.github.io/crosstalk/) to help solve a business problem. `crosstalk` lets you create [Shiny](https://shiny.rstudio.com/)-like 'apps' without Shiny. You might want to do this because you don't have a server to host a Shiny app. It lets filtering of one `crosstalk`-compatible [htmlwidget](https://www.htmlwidgets.org/) (e.g. `leaflet`, `DT` and `plotly`) filter other `crosstalk`-compatible htmlwidgets.
I gave this talk while I worked for the [Department for Education](https://www.gov.uk/government/organisations/department-for-education), part of the UK government. My talk was restricted to **published data only** and the content of the talk **does not reflect or constitute official government policy**. Schools were selected **at random** from open data.
## Full conference blurb
>Crosstalk: Shiny-like without Shiny
>
>Self-service interactive tools have great power to support decisions by policy-makers. Shiny apps are a natural fit for this, but it's not always easy to share them within the public sector. This is due to issues like a lack of server space, highly sensitive data and users who aren't R-savvy.
>
>We've approached this problem in the UK's Department for Education by sharing interactive HTML widgets – embeddable JavaScript visualisation libraries – within RMarkdown outputs. Interactivity is, however, limited because selections in one widget don’t impact the data presented in another.
>
>Joe Cheng's Crosstalk package (http://rstudio.github.io/crosstalk/) overcomes this with shared data objects that react to user inputs, altering the content of multiple widgets on the fly. I'll explain how I used Crosstalk to develop a 'pseudo-app' for exploring schools data with the Leaflet (maps), Plotly (charts) and DT (tables) widgets inside the Flexdashboard framework and how I shared it easily with policy-making users as a static HTML file for exploration in the browser.
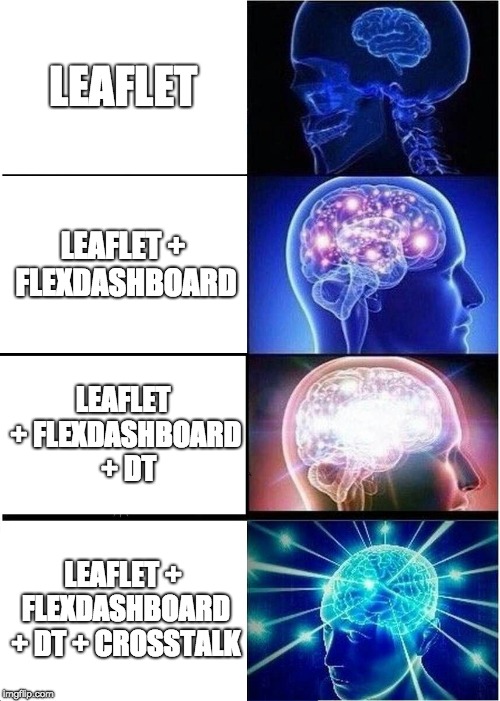
## Stages of development
The talk demonstrated a four-step process in the development of an interactive map tool given user feedback at each stage. Example code is hosted in this repo and the HTML outputs are viewable in-browser. The steps are shown below (click to be taken to the example):
1. [Leaflet](https://matt-dray.github.io/earl18-crosstalk/01_leaflet.html)
2. [Leaflet + Flexdashboard](https://matt-dray.github.io/earl18-crosstalk/02_leaflet-flexdash.html)
3. [Leaflet + Flexdashboard + DT](https://matt-dray.github.io/earl18-crosstalk/03_leaflet-flexdash-dt.html)
4. [Leaflet + Flexdashboard + DT + Crosstalk](https://matt-dray.github.io/earl18-crosstalk/04_leaflet-flexdash-dt-crosstalk.html)
And in meme format if you prefer: