Ecosyste.ms: Awesome
An open API service indexing awesome lists of open source software.
https://github.com/mednour2019/reporting-chart-js
Quality Analysis Application: reporting-front-chart js
https://github.com/mednour2019/reporting-chart-js
angular bootstrap chartjs css font-awesome html javascript jwt-authentication kendoui material-design mvc rest-api swagger typescript
Last synced: about 1 month ago
JSON representation
Quality Analysis Application: reporting-front-chart js
- Host: GitHub
- URL: https://github.com/mednour2019/reporting-chart-js
- Owner: mednour2019
- Created: 2024-07-25T12:22:31.000Z (6 months ago)
- Default Branch: main
- Last Pushed: 2024-11-28T17:52:53.000Z (about 1 month ago)
- Last Synced: 2024-11-28T18:36:29.562Z (about 1 month ago)
- Topics: angular, bootstrap, chartjs, css, font-awesome, html, javascript, jwt-authentication, kendoui, material-design, mvc, rest-api, swagger, typescript
- Homepage: https://prtfnour.vercel.app/project-description/project-desc.html?project=project11
- Size: 21.6 MB
- Stars: 0
- Watchers: 1
- Forks: 0
- Open Issues: 0
-
Metadata Files:
- Readme: README.md
Awesome Lists containing this project
README
# Quality Analysis Application :Front ENd Part Code
# The project is in main Branch
# Description
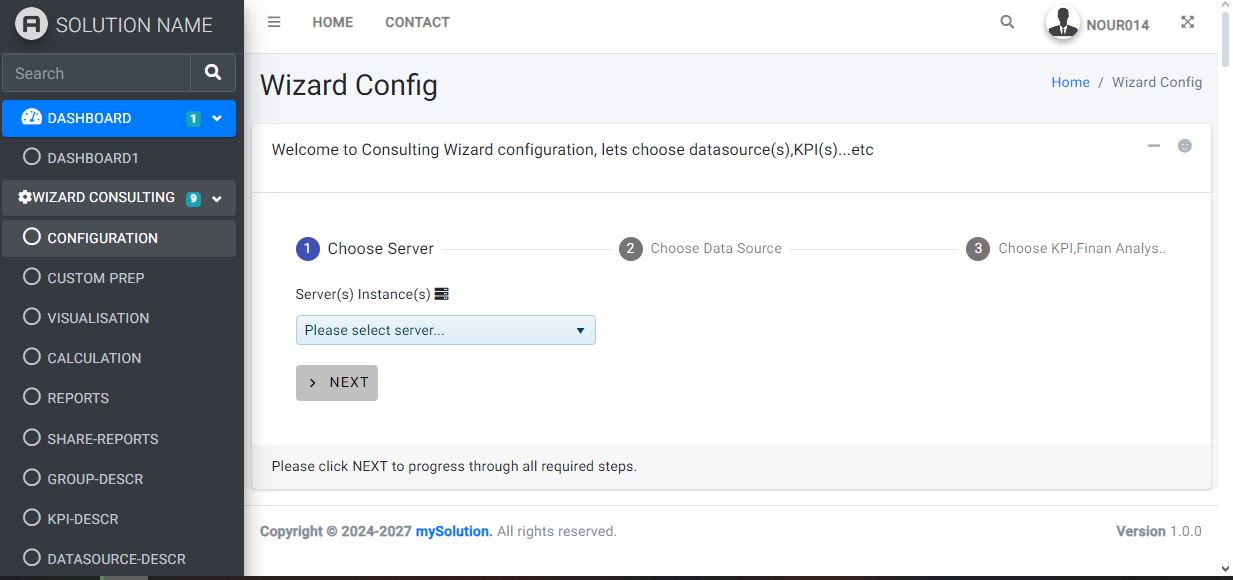
The Quality Analysis Application allows users to easily manage data visualization in reports and offers drag-and-drop chart options similar to Power BI, including bar charts, stacked charts, line charts, and pie charts. Users can also download data in Excel format. The application provides detailed descriptions of entities and KPIs for comprehensive quality analysis.

## Features
- 🧩 Login: Secure login interface for accessing the Quality Analysis Application.
- 🧩 Choose KPI: Select key performance indicators (KPIs) for analysis and reporting.
- 🧩 Random puzzle generation with guaranteed unique solutions
- 🧩 Create Report: Generate comprehensive reports based on selected data and KPIs.
- 🧩 Manage Charts: Easily drag and drop various chart types, including bar, stacked, line, and pie charts, for data visualization.
- 💾 Save Report: Save generated reports for future reference and analysis
- 🔍 Historical and Descriptive Notes: Add historical and descriptive notes to dimensions and measures for detailed context.
## Getting Started
### Prerequisites
- Visual Studio 2019 or later
- .Net Core Web Api
- Angular 15
- Kendo JQUERY 2019
## Contributing
Contributions are what make the open source community such an amazing place to learn, inspire, and create. Any contributions you make are **greatly appreciated**.
1. Fork the Project
2. Create your Feature Branch (`git checkout -b feature/AmazingFeature`)
3. Commit your Changes (`git commit -m 'Add some AmazingFeature'`)
4. Push to the Branch (`git push origin feature/AmazingFeature`)
5. Open a Pull Request
## License
Distributed under the MIT License. See `LICENSE` for more information.
## Contact
Mohamed Nour KHammeri - [@My-Web-Site](https://prtfnour.vercel.app) - [email protected]
Project Link: [https://github.com/mednour2019/Suduko-Game](https://github.com/mednour2019/reporting-chart-js)