https://github.com/metrue/k7
Run load test and visualize the result in Grafana
https://github.com/metrue/k7
Last synced: 2 months ago
JSON representation
Run load test and visualize the result in Grafana
- Host: GitHub
- URL: https://github.com/metrue/k7
- Owner: metrue
- Created: 2021-04-16T08:56:55.000Z (about 4 years ago)
- Default Branch: master
- Last Pushed: 2021-05-06T09:00:22.000Z (almost 4 years ago)
- Last Synced: 2025-01-11T02:29:15.585Z (4 months ago)
- Language: JavaScript
- Size: 85 KB
- Stars: 0
- Watchers: 3
- Forks: 0
- Open Issues: 0
-
Metadata Files:
- Readme: README.md
Awesome Lists containing this project
README
# Load Testing
We are doing the loading testing with K6, persist the data into the influxDB and visualize the result in Grafana.
1. Startup influxDB and Grafana instances
```
$ make setup
```
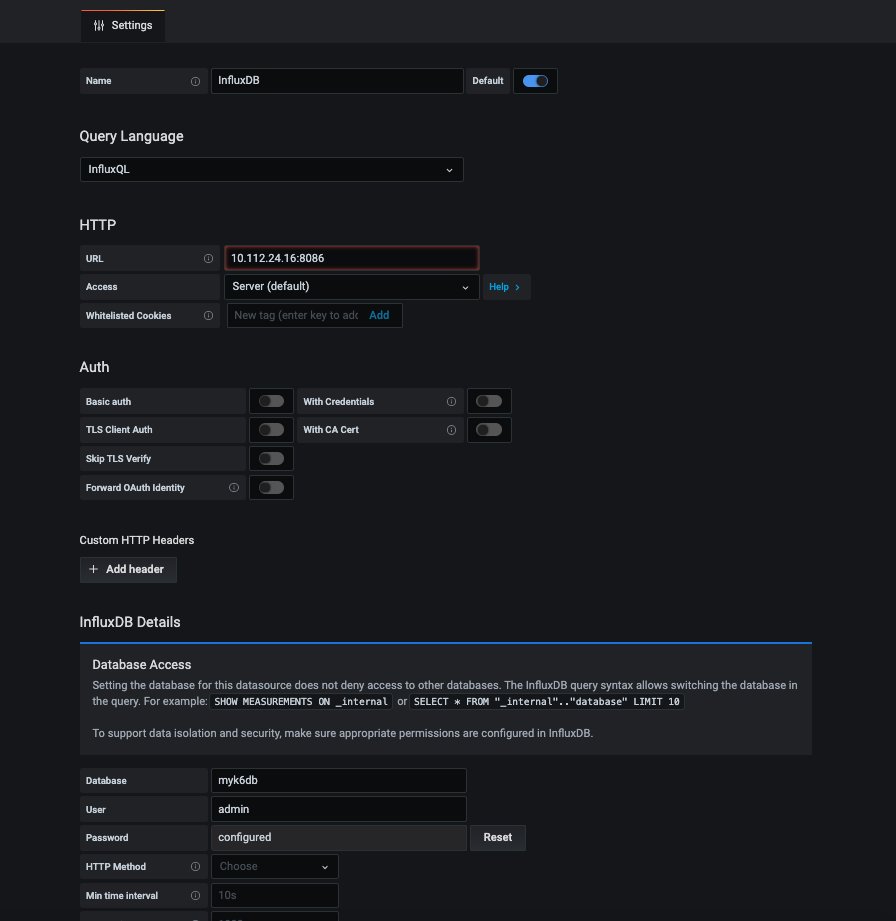
2. Add influxDB as a Data Source of Grafana
Open http://localhost:3000 to login with the default username and password `admin/admin` , then add the influxDB data source and configure the database name. Since influxDB is running with docker compose, source you should get the real IP address of you machine and input it into data source config, `localhost` may not work.

3. Configure the dashboard
Mouse over “+” on the left menu and you will see “Import”, then import from `docker/grafan_dashboard.json`
4. Run the load test
You should update the API endpoint in `/scripts/load_test.js` then run `make`
```
$ VUS=100 ITERATIONS=1000 make run
```
Now you can check the running result in Grafana.
**Note**
* Only tested on Mac currently
* You have make sure the influxDB version defined in `docker/grafan_dashboard.json` consist with the version of influxDB , edit it as you need.
```
$ curl -sL -I localhost:8086/ping | grep X-Influxdb-Version
$ cat docker/grafan_dashboard.json | jq '.__requires | .[] | select(.type=="datasource")'
```
### Reference
1. https://k6.io/
2. https://grafana.com/grafana/dashboards/2587