https://github.com/milosmiric/mongodb-datasource
MongoDB datasource plugin for Grafana - query collections using aggregation pipelines with built-in time-range macros, smart filtering, and full BSON type support.
https://github.com/milosmiric/mongodb-datasource
aggregation-pipleline bson grafana grafana-dashboard grafana-datasource grafana-plugin mongodb mongodb-atlas nosql time-series
Last synced: 2 months ago
JSON representation
MongoDB datasource plugin for Grafana - query collections using aggregation pipelines with built-in time-range macros, smart filtering, and full BSON type support.
- Host: GitHub
- URL: https://github.com/milosmiric/mongodb-datasource
- Owner: milosmiric
- License: other
- Created: 2026-03-04T19:41:58.000Z (4 months ago)
- Default Branch: main
- Last Pushed: 2026-04-09T06:27:35.000Z (3 months ago)
- Last Synced: 2026-04-09T08:22:45.060Z (3 months ago)
- Topics: aggregation-pipleline, bson, grafana, grafana-dashboard, grafana-datasource, grafana-plugin, mongodb, mongodb-atlas, nosql, time-series
- Language: TypeScript
- Homepage: https://miric.dev/projects/mongodb-datasource
- Size: 2.18 MB
- Stars: 0
- Watchers: 0
- Forks: 0
- Open Issues: 9
-
Metadata Files:
- Readme: README.md
- Changelog: CHANGELOG.md
- Contributing: CONTRIBUTING.md
- License: LICENSE
Awesome Lists containing this project
README

MongoDB Datasource Plugin for Grafana


A production-quality, open-source MongoDB datasource plugin for Grafana.
Query MongoDB collections using aggregation pipelines with built-in macros, smart filtering, and full BSON type support.
## Why This Plugin?
The official Grafana MongoDB plugin is **Enterprise-only**. The best community alternative is pre-release (v0.5.x). This plugin fills the gap with:
- Go backend for secure, high-performance MongoDB communication
- Raw aggregation pipeline queries with template variable support
- Built-in macros: `$__timeFilter(field)`, `$__timeGroup(field)`, `$__oidFilter(field)`, `$__timeFilter_ms(field)`
- Smart `$__match` stage: index-friendly multi-select and "All" handling (replaces `$regex`)
- 15+ built-in variables: time range, ObjectId, interval decomposition, panel resolution
- Time-series and table output formats
- Full BSON type conversion (ObjectID, Decimal128, Date, arrays, embedded docs, etc.)
- Docker Compose development environment with sample data out of the box
## Screenshots
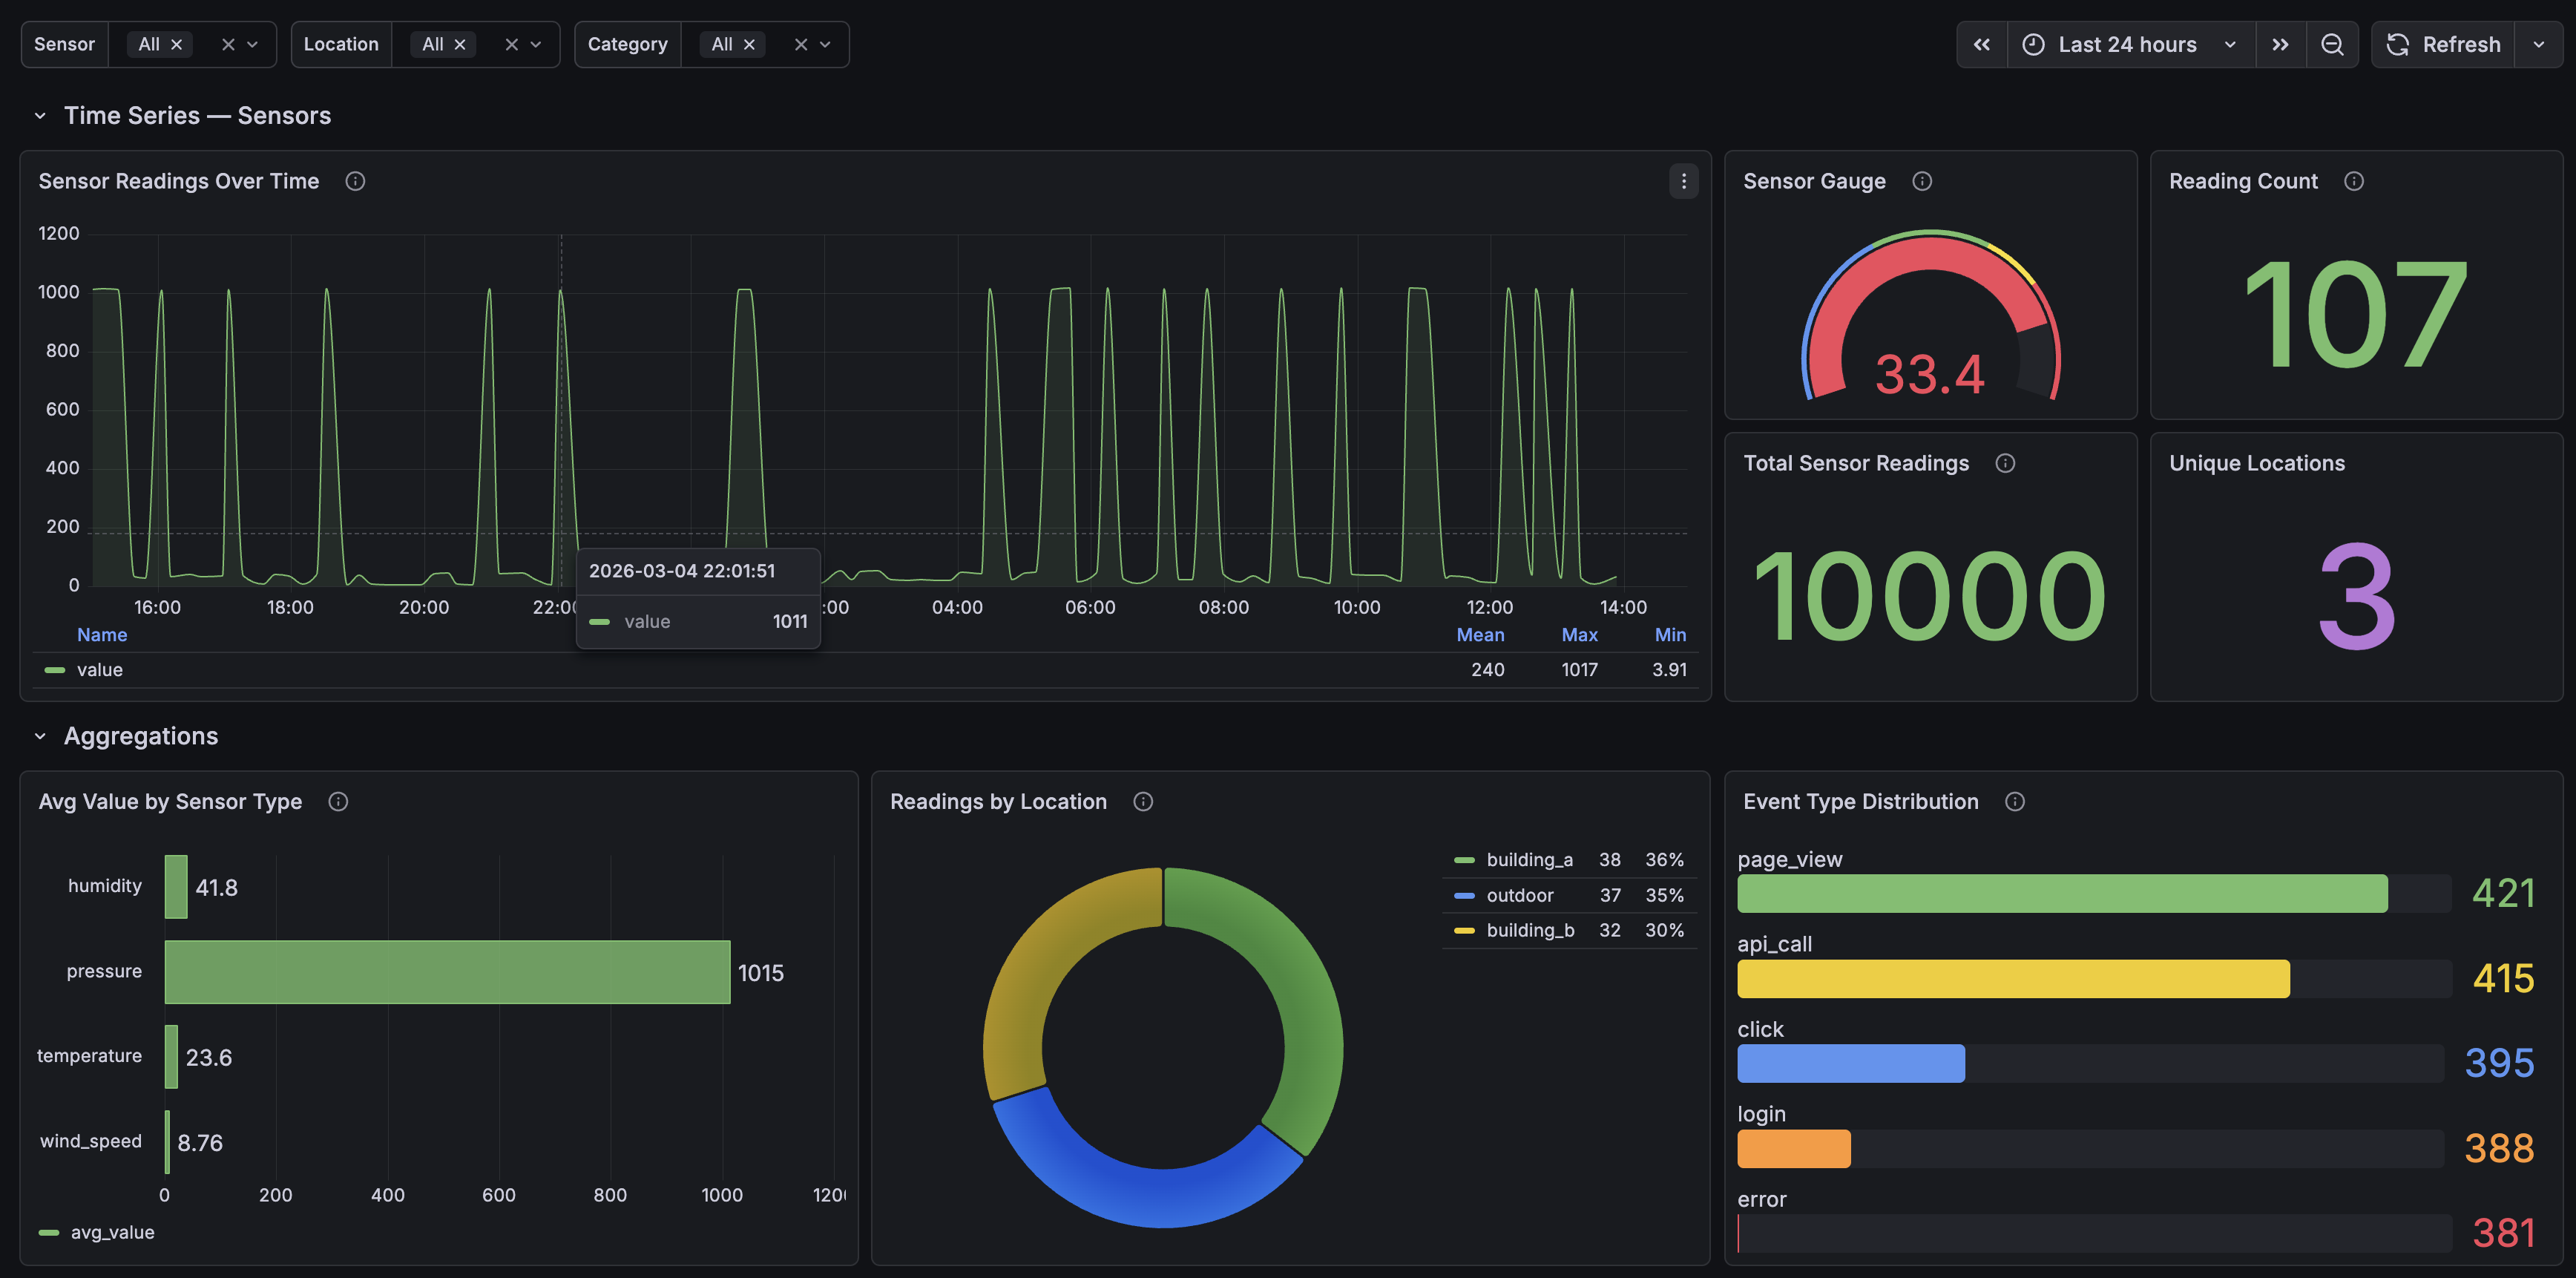
### Sample Dashboard — Time Series, Gauges & Aggregations
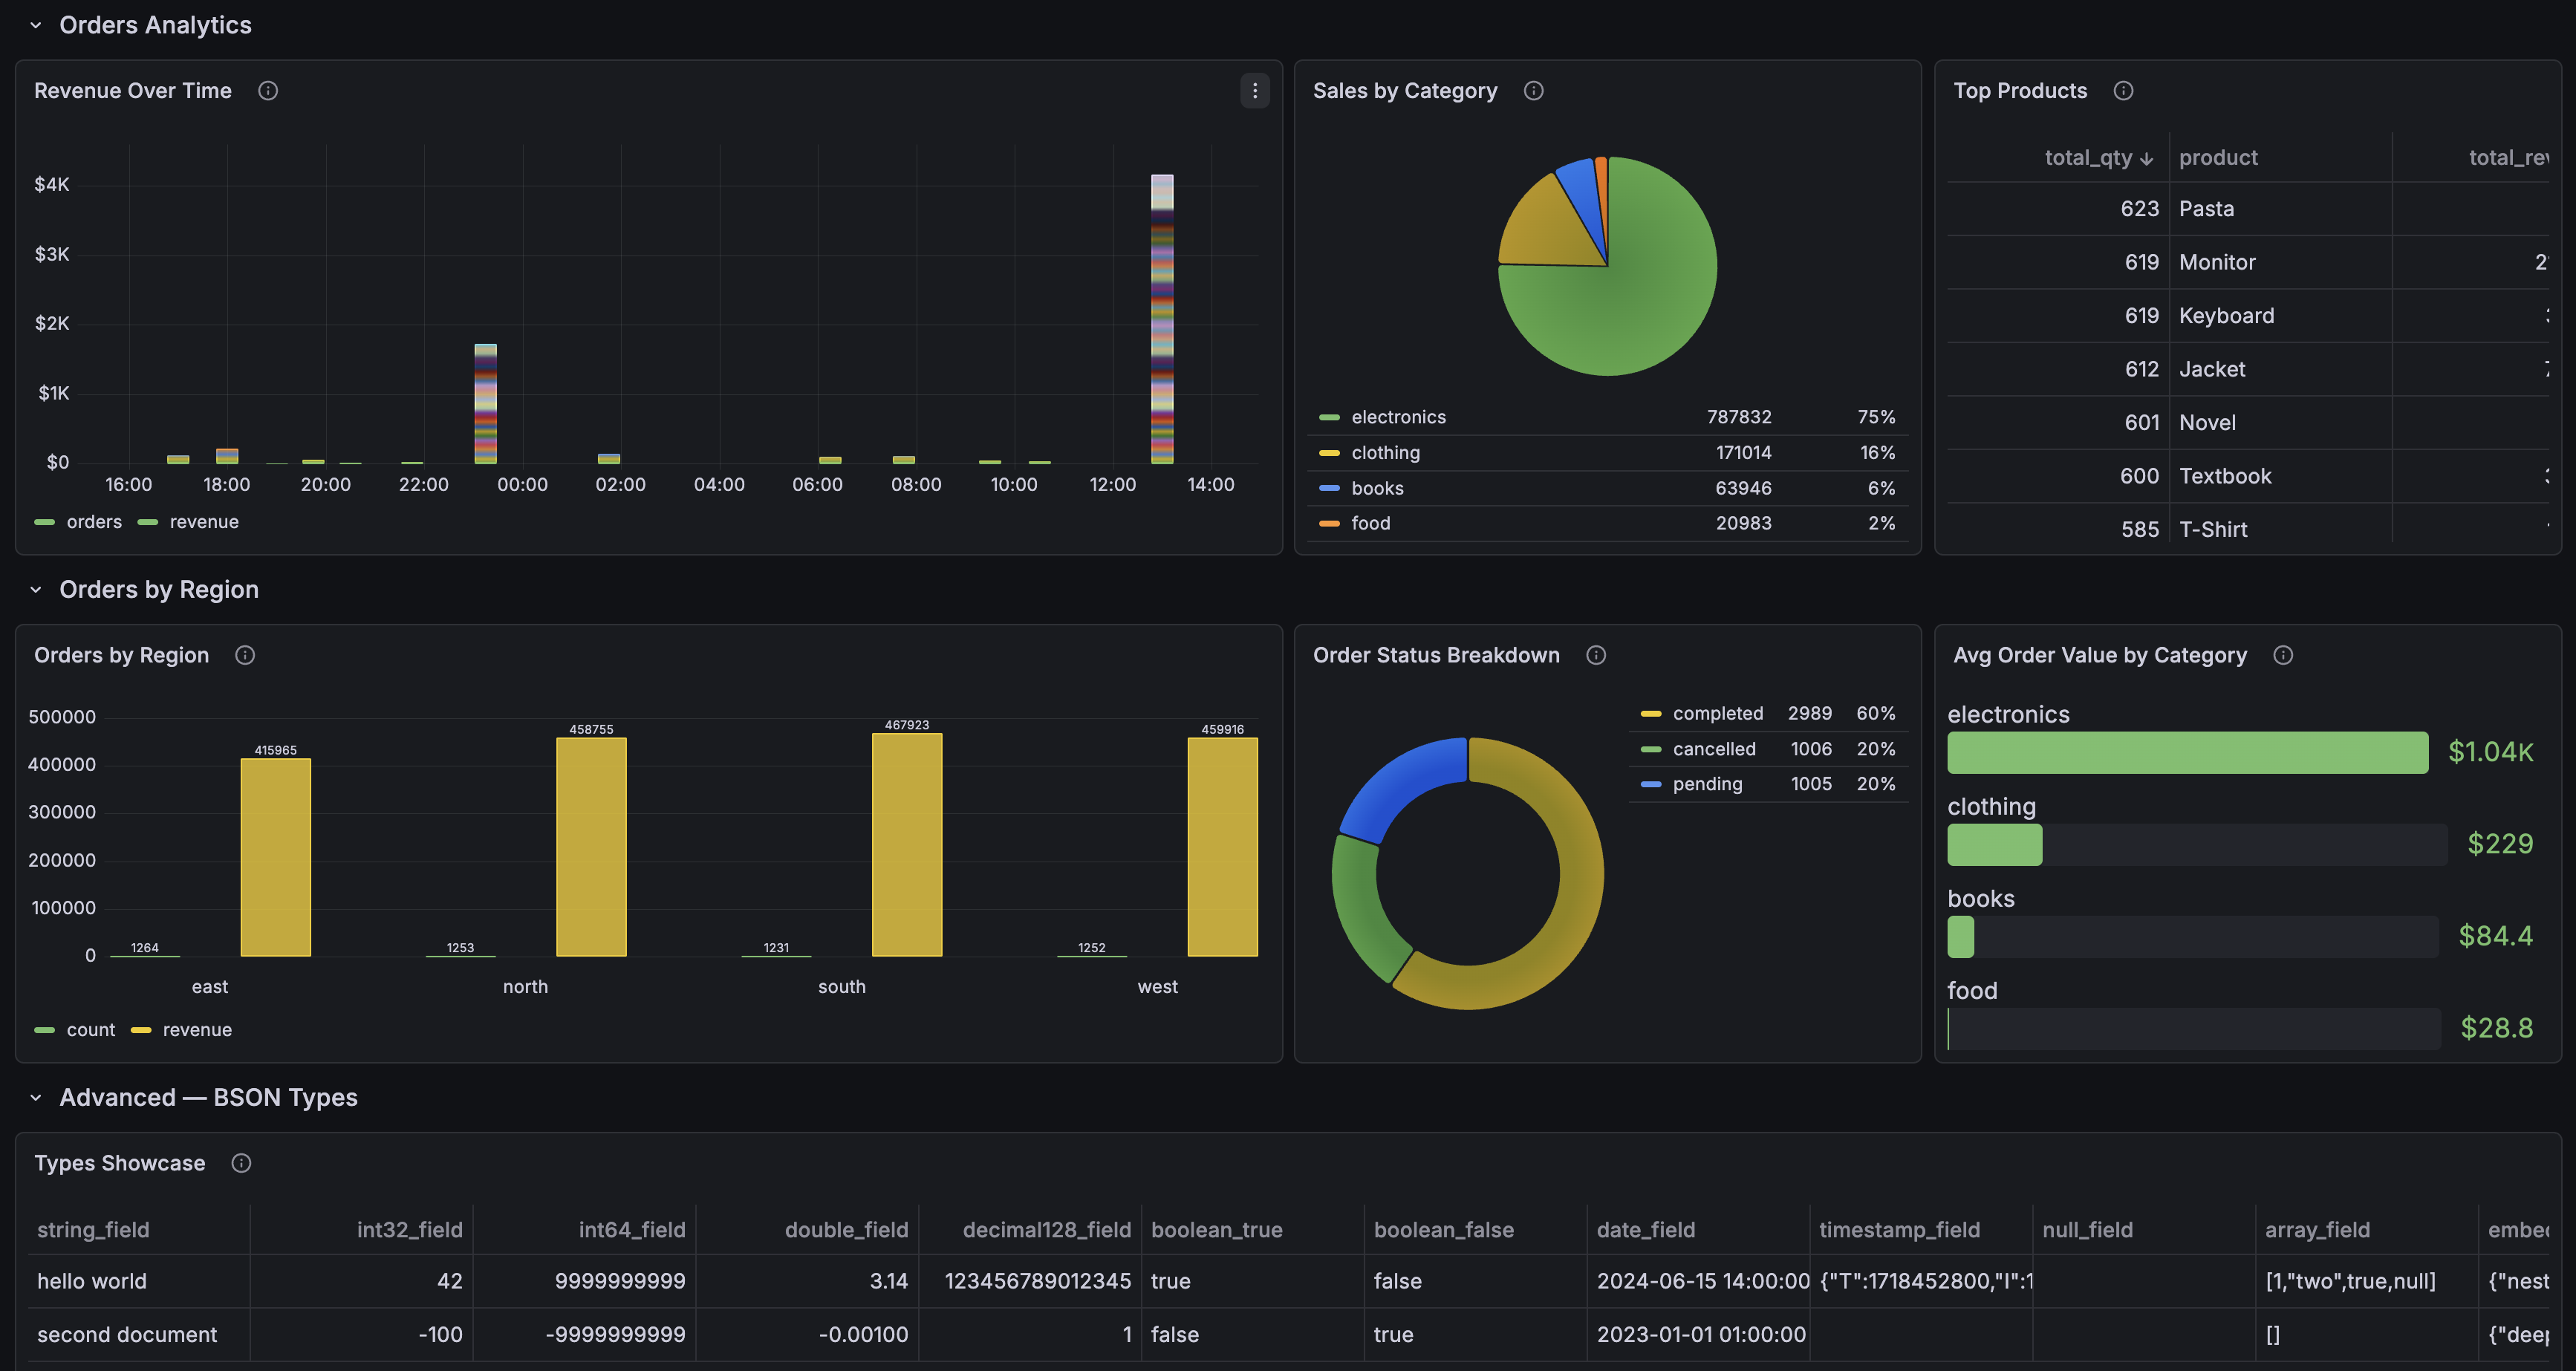
### Sample Dashboard — Orders Analytics & BSON Types
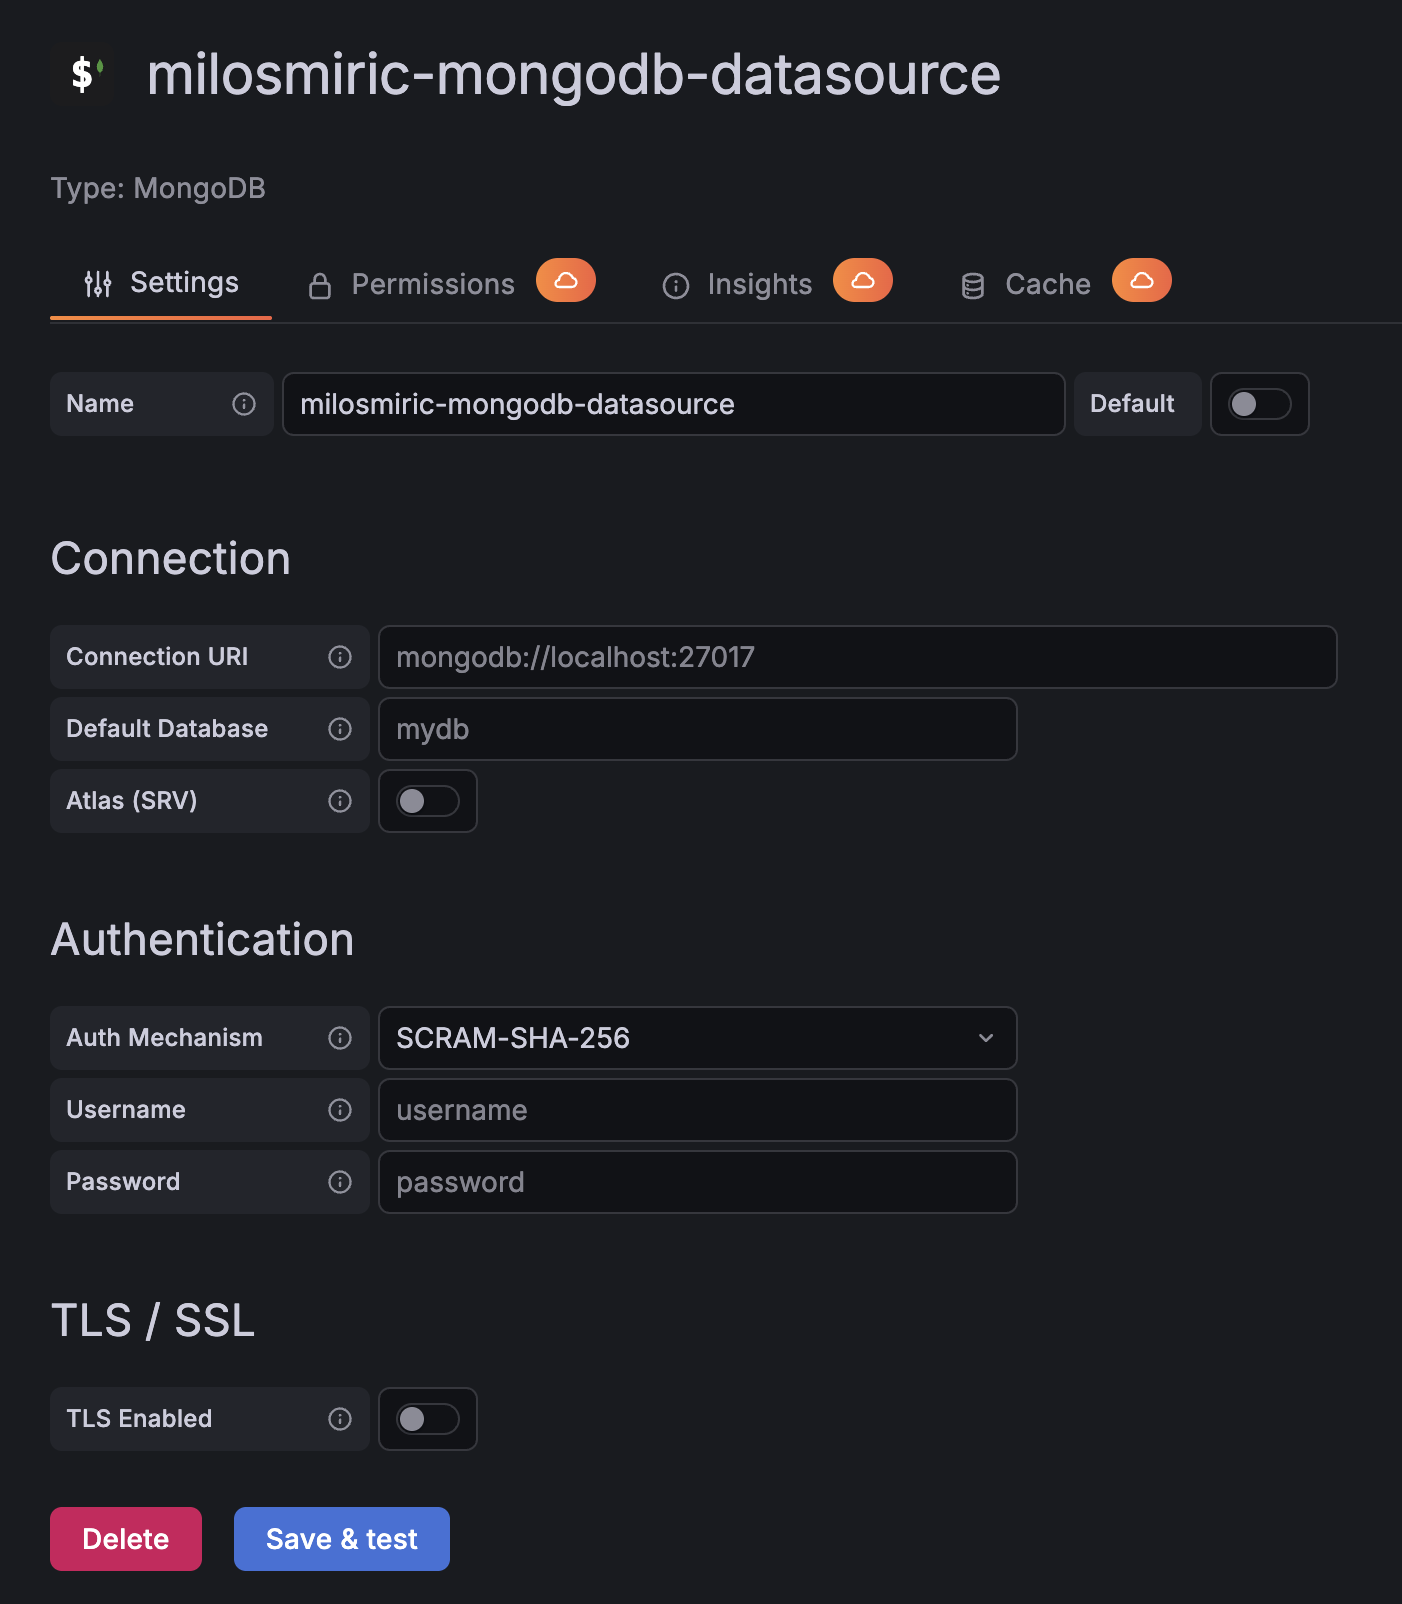
### Configuration
## Quick Start
```bash
docker compose up
```
Open [http://localhost:3105](http://localhost:3105) (admin/admin). The MongoDB datasource and a sample dashboard are pre-configured with demo data.
## Installation
### Unsigned Plugin (Manual)
The plugin is pending Grafana catalog approval. Until then, install it manually:
1. Download the latest `.zip` from [GitHub Releases](https://github.com/milosmiric/mongodb-datasource/releases)
2. Extract to your Grafana plugins directory:
```bash
unzip milosmiric-mongodb-datasource-*.zip -d /var/lib/grafana/plugins/
```
3. Allow the unsigned plugin in your Grafana configuration (`grafana.ini`):
```ini
[plugins]
allow_loading_unsigned_plugins = milosmiric-mongodb-datasource
```
Or via environment variable:
```
GF_PLUGINS_ALLOW_LOADING_UNSIGNED_PLUGINS=milosmiric-mongodb-datasource
```
4. Restart Grafana
### Docker / Docker Compose
Add the environment variable to your Grafana container:
```yaml
environment:
GF_PLUGINS_ALLOW_LOADING_UNSIGNED_PLUGINS: milosmiric-mongodb-datasource
volumes:
- ./path/to/milosmiric-mongodb-datasource:/var/lib/grafana/plugins/milosmiric-mongodb-datasource
```
### Grafana CLI (after catalog approval)
```bash
grafana-cli plugins install milosmiric-mongodb-datasource
```
## Configuration
Point the datasource at your MongoDB instance using a connection URI:
```
mongodb://username:password@host:port/database
```
Supports SCRAM-SHA-256, SCRAM-SHA-1, X.509 authentication, TLS/SSL, and Atlas SRV connections.
See [docs/configuration.md](https://github.com/milosmiric/mongodb-datasource/blob/main/docs/configuration.md) for the full configuration guide including provisioning examples.
## Query Examples
Queries use MongoDB [aggregation pipelines](https://www.mongodb.com/docs/manual/core/aggregation-pipeline/). Select a database and collection, then write a pipeline as a JSON array.
**Time series** — sensor readings scoped to the dashboard time range:
```json
[
{"$match": {$__timeFilter(timestamp)}},
{"$sort": {"timestamp": 1}},
{"$project": {"_id": 0, "timestamp": 1, "value": 1, "location": 1}}
]
```
**Table** — recent documents:
```json
[
{"$sort": {"timestamp": -1}},
{"$limit": 100},
{"$project": {"_id": 0, "name": 1, "email": 1, "role": 1}}
]
```
**Aggregation** — group and count:
```json
[
{"$group": {"_id": "$type", "count": {"$sum": 1}}},
{"$sort": {"count": -1}}
]
```
Built-in macros (`$__timeFilter`, `$__timeGroup`, `$__oidFilter`, `$__timeFilter_ms`), smart match (`$__match`), and 15+ template variables. See [docs/template-variables.md](https://github.com/milosmiric/mongodb-datasource/blob/main/docs/template-variables.md) for the complete reference.
See [docs/queries.md](https://github.com/milosmiric/mongodb-datasource/blob/main/docs/queries.md) for the full query guide with patterns for time bucketing, joins, variable dropdowns, and performance tips.
## Development
### Prerequisites
- [Node.js](https://nodejs.org/) >= 22
- [Go](https://go.dev/) >= 1.23
- [Mage](https://magefile.org/) (Go build tool)
- [Docker](https://www.docker.com/) and Docker Compose
### Build & Run
```bash
npm install # Install frontend dependencies
make build # Build frontend + backend
make up # Start Grafana + MongoDB
```
### Common Commands
All development tasks are available as `make` targets. Run `make help` for the full list.
| Command | Description |
|---------|-------------|
| `make build` | Build frontend and backend |
| `make dev` | Start frontend in watch mode |
| `make test` | Run all tests (Go + Jest) |
| `make lint` | Run all linters |
| `make up` / `make down` | Start / stop Docker environment |
| `make rebuild` | Build everything and restart Grafana |
| `make db-seed` | Seed MongoDB with demo data |
| `make db-reset` | Drop demo database and re-seed |
| `make db-random` | Insert 500 random sensor readings |
| `make health` | Check Grafana and datasource health |
| `make fresh` | Full clean rebuild from scratch |
See [docs/development.md](https://github.com/milosmiric/mongodb-datasource/blob/main/docs/development.md) for the full development guide covering architecture, debugging, CI/CD, and project structure.
## Architecture
```mermaid
graph LR
A[Grafana Frontend] -->|gRPC| B[Go Backend Plugin]
B -->|mongo-driver/v2| C[MongoDB]
A -->|React Components| D[Query Editor]
A -->|React Components| E[Config Editor]
D -->|HTTP Resource| B
E -->|HTTP Resource| B
```
- **Frontend** (`src/`): React/TypeScript — config editor, query editor, data fetching hooks
- **Backend** (`pkg/`): Go — MongoDB connections, aggregation pipeline execution, BSON→DataFrame conversion
- **Communication**: `DataSourceWithBackend` proxies queries to the Go backend via gRPC
## Roadmap
Future milestones:
- Visual query builder (drag-and-drop pipeline stages)
- Change streams / live streaming
- Schema introspection and field autocomplete
- Alerting-specific features
- Annotation queries
- Explore integration
## Contributing
See [CONTRIBUTING.md](https://github.com/milosmiric/mongodb-datasource/blob/main/CONTRIBUTING.md) for branch naming, PR process, code style, and test requirements.
## Author
**Miloš Mirić** — Senior Solutions Architect at MongoDB
- Website: [miric.dev](https://miric.dev)
- LinkedIn: [milosmiric](https://www.linkedin.com/in/milosmiric/)
- GitHub: [milosmiric](https://github.com/milosmiric)
## License
GNU Affero General Public License v3.0. See [LICENSE](https://github.com/milosmiric/mongodb-datasource/blob/main/LICENSE).