https://github.com/mingrammer/diagrams
:art: Diagram as Code for prototyping cloud system architectures
https://github.com/mingrammer/diagrams
architecture diagram diagram-as-code graphviz
Last synced: 23 days ago
JSON representation
:art: Diagram as Code for prototyping cloud system architectures
- Host: GitHub
- URL: https://github.com/mingrammer/diagrams
- Owner: mingrammer
- License: mit
- Created: 2020-02-02T15:23:24.000Z (over 6 years ago)
- Default Branch: master
- Last Pushed: 2025-05-05T09:07:47.000Z (about 1 year ago)
- Last Synced: 2025-05-05T15:11:26.270Z (about 1 year ago)
- Topics: architecture, diagram, diagram-as-code, graphviz
- Language: Python
- Homepage: https://diagrams.mingrammer.com
- Size: 58.6 MB
- Stars: 40,754
- Watchers: 407
- Forks: 2,617
- Open Issues: 379
-
Metadata Files:
- Readme: README.md
- Changelog: CHANGELOG.md
- Contributing: CONTRIBUTING.md
- License: LICENSE
Awesome Lists containing this project
- awesome-software-design - Diagrams as Code - Draw AWS, Azure, GCP, and Kubernetes architecture diagrams in Python with provider icons. (Documentation as Code / Design Patterns)
- fucking-awesome-python-cn - diagrams
- Awesome - Diagrams - Diagram as Code for prototyping cloud system architectures (Multimedia / Image and pictures)
- awesome-list - Diagrams - Lets you draw the cloud system architecture in Python code. (Data Visualization / Data Management)
- awesome-python-zh - diagrams - 作为代码的图表。 (数据可视化)
- awesome-engineering-toolbox - Diagrams - Draw cloud architecture diagrams in Python code. (Productivity Tools / Documentation & Diagramming)
- awesome-platform-engineering - mingrammer/diagrams - Draw diagrams in Python code (Diagrams as code / Build systems)
- awesomeLibrary - diagrams
- awesome-starred - mingrammer/diagrams - :art: Diagram as Code for prototyping cloud system architectures (others)
- StarryDivineSky - mingrammer/diagrams - Premise 节点、 SaaS 主要 Programming 框架和语言。 (其他__大数据 / 网络服务_其他)
- awesome-kubernetes-architecture-diagrams - https://github.com/mingrammer/diagrams
- awesome-python - diagrams - Diagram as Code. (Data Visualization)
- python-awesome - diagrams - Diagram as Code. (Data Visualization)
- awesome-python-resources - GitHub - 59% open · ⏱️ 10.08.2022): (数据可视化)
- AiTreasureBox - mingrammer/diagrams - 11-03_41686_0](https://img.shields.io/github/stars/mingrammer/diagrams.svg)|🎨 Diagram as Code for prototyping cloud system architectures| (Repos)
- awesome-python - diagrams - Diagram as Code for prototyping cloud system architectures ` 📝 a month ago ` (Data Visualization [🔝](#readme))
- fucking-awesome-python - diagrams - Diagram as Code. (Data Visualization)
- fucking-awesome-python - :octocat: diagrams - :star: 30222 :fork_and_knife: 1918 - Diagram as Code. (Data Visualization)
- awesome - mingrammer/diagrams - :art: Diagram as Code for prototyping cloud system architectures (Python)
- awesome-python-cn - diagrams
- awesome-ccamel - mingrammer/diagrams - :art: Diagram as Code for prototyping cloud system architectures (Python)
- awesome-python - diagrams - Diagram as Code. (Data Visualization)
- jimsghstars - mingrammer/diagrams - :art: Diagram as Code for prototyping cloud system architectures (Python)
- awesome-python-data-science - diagrams - Diagrams lets you draw the cloud system architecture in Python code. (Visualization)
- my-awesome-starred - mingrammer/diagrams - :art: Diagram as Code for prototyping cloud system architectures (Python)
- awesome-devops - diagrams - :art: Diagram as Code for prototyping cloud system architectures. (Other / Observability)
- awesome-data-analysis - Diagrams - Diagrams as code for cloud architecture. (📦 Additional Python Libraries / Miscellaneous)
- awesome-python-data-visualization - diagrams - Diagram as Code. (Not in PyViz)
- awesome-starts - mingrammer/diagrams - :art: Diagram as Code for prototyping cloud system architectures (Python)
- awesome-github-projects - diagrams - :art: Diagram as Code for prototyping cloud system architectures ⭐42,459 `Python` 🔥 (🔧 Utilities & Miscellaneous)
- awesome-fancy-toolkit - Linux好用的架构图制作工具, Diagrams
- best-of-python - GitHub - 62% open · ⏱️ 07.02.2026): (Others)
- awesome-list - diagrams
- awesome-arsenal - diagrams - 绘制云系统架构图。 (武器库 / 其他)
- awesome-sources - Diagram as Code - Diagrams lets you draw the cloud system architecture in Python code. (Tools)
- my-awesome-github-stars - mingrammer/diagrams - :art: Diagram as Code for prototyping cloud system architectures (Python)
- my-awesome - mingrammer/diagrams - as-code,graphviz pushed_at:2026-06 star:42.4k fork:2.7k :art: Diagram as Code for prototyping cloud system architectures (Python)
- awesome-knowledge-infrastructure - Diagrams - A Python library for drawing cloud system architecture diagrams as code. (Diagramming and Visualization as Code)
README

# Diagrams
[](/LICENSE)
[](https://badge.fury.io/py/diagrams)


[](https://www.tickgit.com/browse?repo=github.com/mingrammer/diagrams)


**Diagram as Code**.
Diagrams lets you draw the cloud system architecture **in Python code**. It was born for **prototyping** a new system architecture design without any design tools. You can also describe or visualize the existing system architecture as well. Diagrams currently supports main major providers including: `AWS`, `Azure`, `GCP`, `Kubernetes`, `Alibaba Cloud`, `Oracle Cloud` etc... It also supports `On-Premises` nodes, `SaaS` and major `Programming` frameworks and languages.
**Diagram as Code** also allows you to **track** the architecture diagram changes in any **version control** system.
> NOTE: It does not control any actual cloud resources nor does it generate cloud formation or terraform code. It is just for drawing the cloud system architecture diagrams.
## Providers


## Getting Started
It requires **Python 3.9** or higher, check your Python version first.
It uses [Graphviz](https://www.graphviz.org/) to render the diagram, so you need to [install Graphviz](https://graphviz.gitlab.io/download/) to use **diagrams**. After installing graphviz (or already have it), install the **diagrams**.
> macOS users can download the Graphviz via `brew install graphviz` if you're using [Homebrew](https://brew.sh).
```shell
# using pip (pip3)
$ pip install diagrams
# using pipenv
$ pipenv install diagrams
# using poetry
$ poetry add diagrams
```
You can start with [quick start](https://diagrams.mingrammer.com/docs/getting-started/installation#quick-start). Check out [guides](https://diagrams.mingrammer.com/docs/guides/diagram) for more details, and you can find all available nodes list in [here](https://diagrams.mingrammer.com/docs/nodes/aws).
## Examples
| Event Processing | Stateful Architecture | Advanced Web Service |
| ------------------------------------------------------------ | ------------------------------------------------------------ | ------------------------------------------------------------ |
| 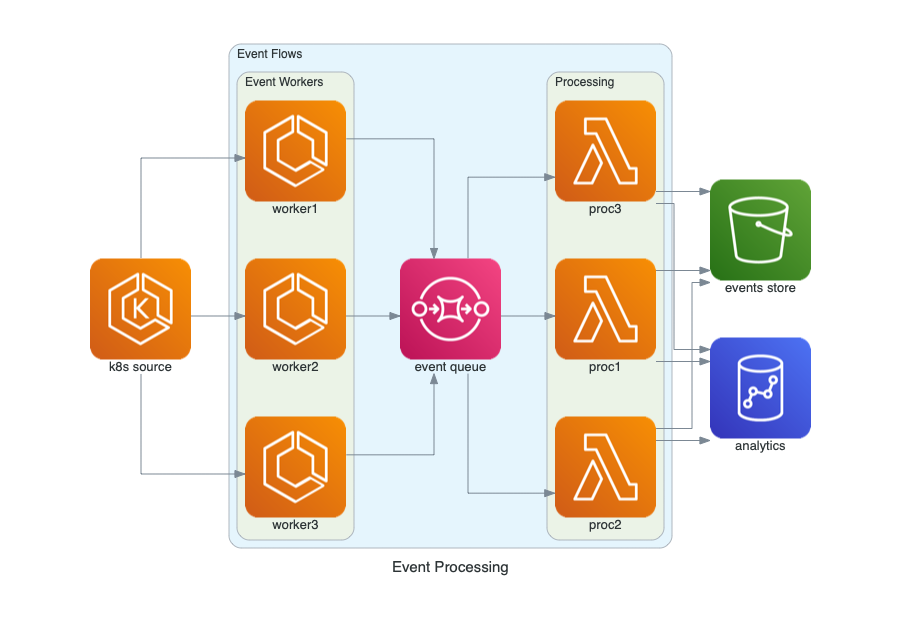 | 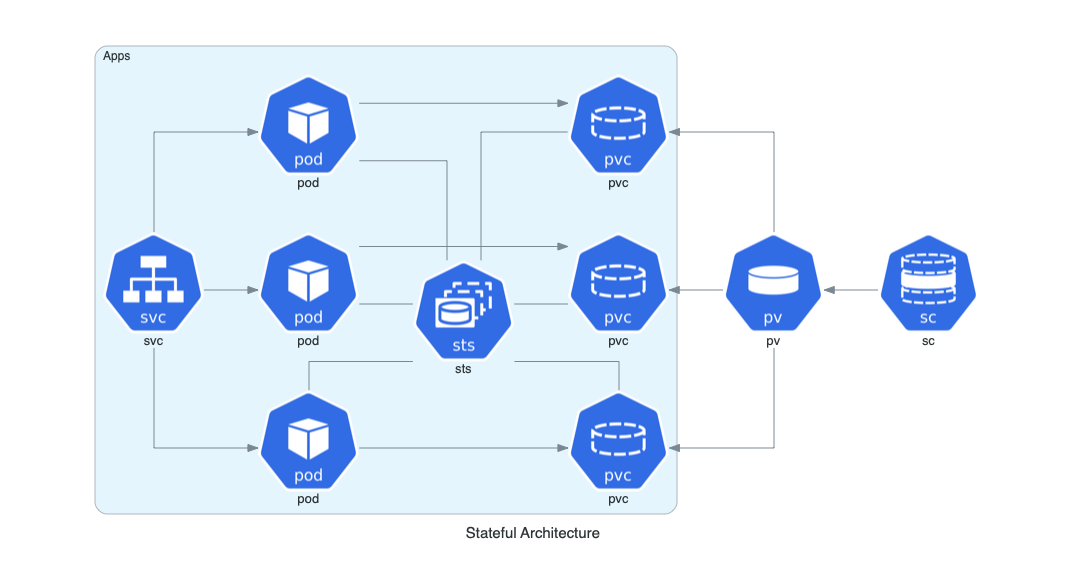 | 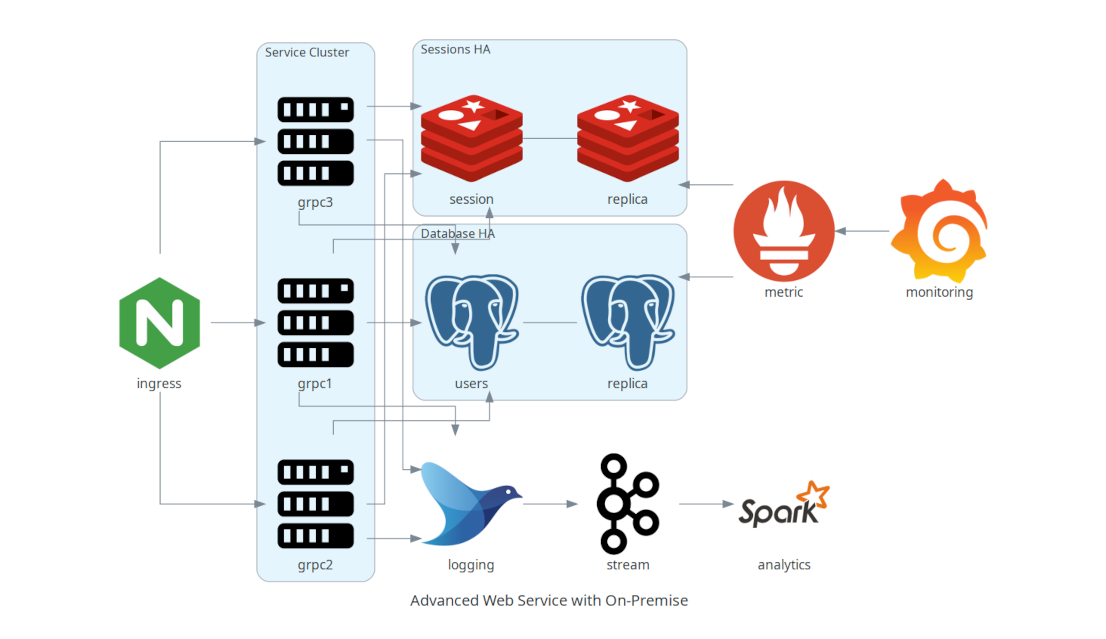 |
You can find all the examples on the [examples](https://diagrams.mingrammer.com/docs/getting-started/examples) page.
## Contributing
To contribute to diagram, check out [contribution guidelines](CONTRIBUTING.md).
> Let me know if you are using diagrams! I'll add you in showcase page. (I'm working on it!) :)
## Who uses it?
[Apache Airflow](https://github.com/apache/airflow) is the most popular data workflow Orchestrator. Airflow uses Diagrams to generate architecture diagrams in their documentation.
[Cloudiscovery](https://github.com/Cloud-Architects/cloudiscovery) helps you to analyze resources in your cloud (AWS/GCP/Azure/Alibaba/IBM) account. It allows you to create a diagram of analyzed cloud resource map based on this Diagrams library, so you can draw your existing cloud infrastructure with Cloudiscovery.
[Airflow Diagrams](https://github.com/feluelle/airflow-diagrams) is an Airflow plugin that aims to easily visualise your Airflow DAGs on service level from providers like AWS, GCP, Azure, etc. via diagrams.
[KubeDiagrams](https://github.com/philippemerle/KubeDiagrams) is a tool to generate Kubernetes architecture diagrams from Kubernetes manifest files, kustomization files, Helm charts, and actual cluster state. [KubeDiagrams](https://github.com/philippemerle/KubeDiagrams) supports all Kubernetes built-in resources, any custom resources, and label-based resource clustering.
## Other languages
- If you are familiar with Go, you can use [go-diagrams](https://github.com/blushft/go-diagrams) as well.
## License
[MIT](LICENSE)