https://github.com/minhosong88/data_visualization_r
Data Visualization project with Economist Corroption-Human Development Index
https://github.com/minhosong88/data_visualization_r
datavisualization ggplot2 ggplot2-theme r rstudio
Last synced: about 1 year ago
JSON representation
Data Visualization project with Economist Corroption-Human Development Index
- Host: GitHub
- URL: https://github.com/minhosong88/data_visualization_r
- Owner: minhosong88
- Created: 2025-01-27T15:57:03.000Z (over 1 year ago)
- Default Branch: main
- Last Pushed: 2025-01-27T17:57:53.000Z (over 1 year ago)
- Last Synced: 2025-02-05T04:40:31.957Z (over 1 year ago)
- Topics: datavisualization, ggplot2, ggplot2-theme, r, rstudio
- Language: R
- Homepage:
- Size: 164 KB
- Stars: 0
- Watchers: 1
- Forks: 0
- Open Issues: 0
-
Metadata Files:
- Readme: README.md
Awesome Lists containing this project
README
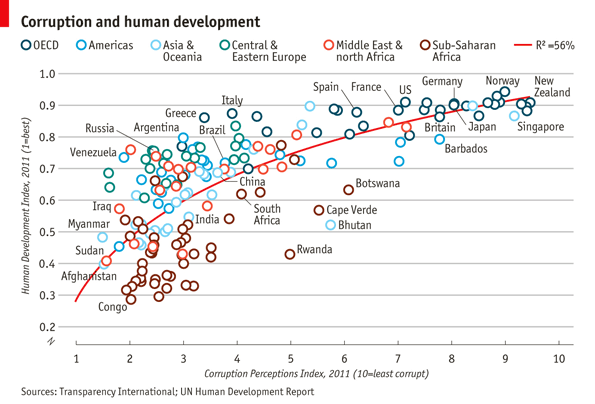
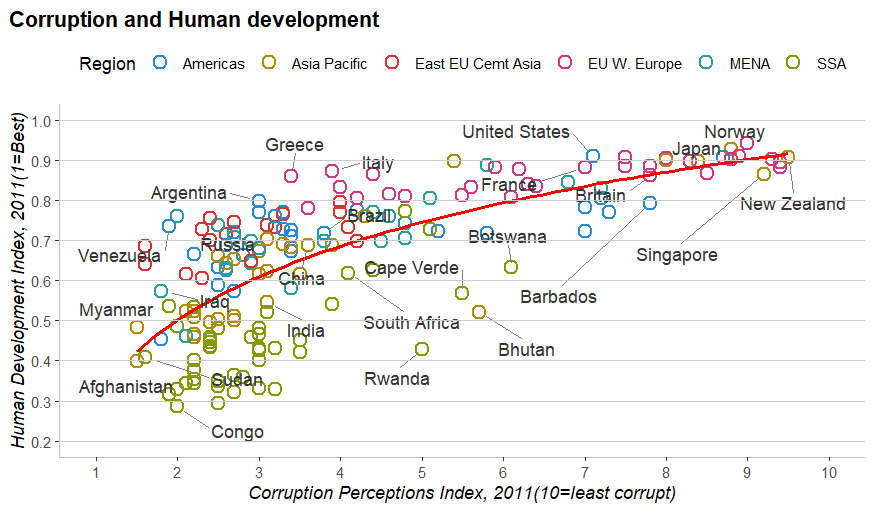
# **Corruption and Human Development Visualization**
## **Overview**
This project recreates the Economist's "Corruption and Human Development" plot using R and ggplot2. The visualization showcases the relationship between the **Corruption Perceptions Index (CPI)** and the **Human Development Index (HDI)** across regions, with annotations for selected countries.
---
## **Original Image**
Below is the original plot from the Economist:
---
## **My Plot**
Below is my version of the plot created using R:
---
## **Features**
1. **Scatter Plot**: Points represent countries, colored by region.
2. **Trend Line**: A red logarithmic regression line shows the general trend.
3. **Country Labels**: Selected countries are labeled with connecting lines to avoid overlap.
4. **Custom Legend**: A horizontal legend is placed at the top.
5. **Styled Axes**: Axis titles are italicized, with customized scales and breaks.
6. **Grid Lines**: Minor grid lines are removed, and horizontal grid lines are manually added.
---
## **Output**
This plot effectively replicates the Economist's original visualization, showcasing the relationship between corruption and human development while maintaining a clean and professional style.