https://github.com/mjebrahimi/benchmarkdotnetvisualizer
🌈 Visualizes your BenchmarkDotNet benchmarks to Colorful images and Feature-rich HTML (and maybe powerful charts in the future!)
https://github.com/mjebrahimi/benchmarkdotnetvisualizer
benchmark benchmarkdotnet benchmarking benchmarks csharp dotnet exporter performance performance-visualization visualization visualizer
Last synced: over 1 year ago
JSON representation
🌈 Visualizes your BenchmarkDotNet benchmarks to Colorful images and Feature-rich HTML (and maybe powerful charts in the future!)
- Host: GitHub
- URL: https://github.com/mjebrahimi/benchmarkdotnetvisualizer
- Owner: mjebrahimi
- License: mit
- Created: 2024-01-17T16:40:01.000Z (over 2 years ago)
- Default Branch: master
- Last Pushed: 2025-02-10T18:04:37.000Z (over 1 year ago)
- Last Synced: 2025-04-02T04:08:05.080Z (over 1 year ago)
- Topics: benchmark, benchmarkdotnet, benchmarking, benchmarks, csharp, dotnet, exporter, performance, performance-visualization, visualization, visualizer
- Language: HTML
- Homepage: https://mjebrahimi.github.io/BenchmarkDotNetVisualizer/
- Size: 6.86 MB
- Stars: 50
- Watchers: 1
- Forks: 2
- Open Issues: 5
-
Metadata Files:
- Readme: README.md
- License: LICENSE
Awesome Lists containing this project
README
**Examples:**
- [Online Demo 1](https://mjebrahimi.github.io/BenchmarkDotNetVisualizer/docs/json-serializers-benchmark.html)
- [Online Demo 2](https://mjebrahimi.github.io/BenchmarkDotNetVisualizer/docs/iteration-benchmark1.html)
- [Online Demo 3](https://mjebrahimi.github.io/BenchmarkDotNetVisualizer/docs/iteration-benchmark2.html)
[](https://www.nuget.org/packages/BenchmarkDotNetVisualizer)
[](https://www.nuget.org/packages/BenchmarkDotNetVisualizer)
[](https://opensource.org/licenses/MIT)
[](https://github.com/mjebrahimi/BenchmarkDotNetVisualizer)
# BenchmarkDotNetVisualizer
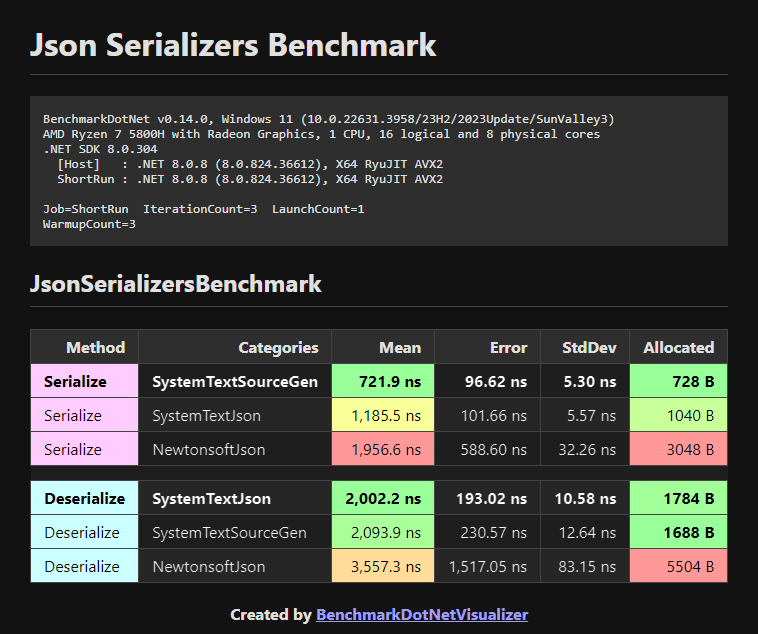
Visualizes your [BenchmarkDotNet](https://github.com/dotnet/BenchmarkDotNet/) benchmarks to **Colorful** images and **Feature-rich** HTML (and maybe powerful charts in the future!)
**Dark Theme:**
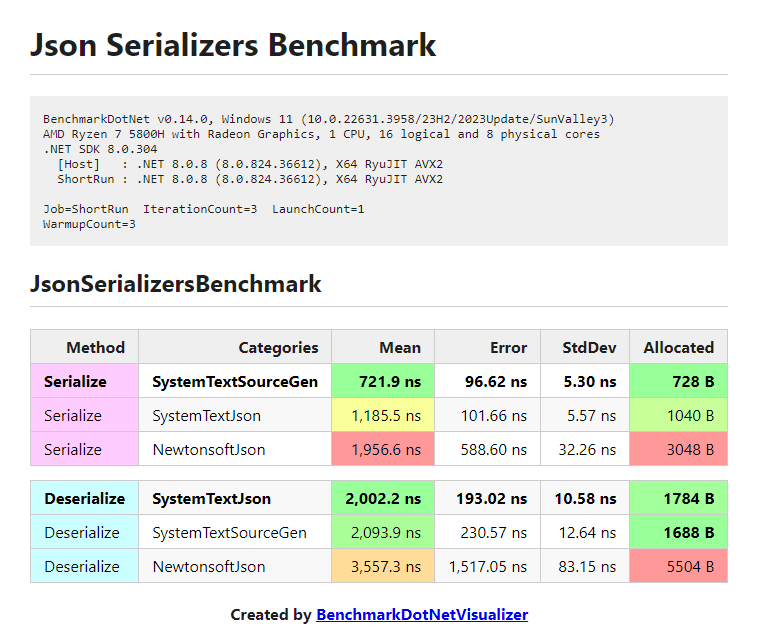
**Light Theme:**
## A Real World Demo (.NET Collections Benchmark 🚀)
A Comprehensive Performance Comparison Benchmark Between Different .NET Collections.
https://github.com/mjebrahimi/DotNet-Collections-Benchmark/
## Getting Started
### 1. Install Package
```ini
PM> Install-Package BenchmarkDotNetVisualizer
```
### 2. Using Methods (Recommended)
**Methods:**
- **SaveAsImageAsync()**
- **SaveAsHtmlAsync()**
- **SaveAsHtmlAndImageAsync()**
**Example:**
```csharp
var summary = BenchmarkAutoRunner.Run(); //Prefer to use BenchmarkAutoRunner instead of BenchmarkRunner
//[ProjectDirectory]\Reports\Benchmark-Dark.html
var htmlPath = DirectoryHelper.GetPathRelativeToProjectDirectory(@"Reports\Benchmark-Dark.html");
//[ProjectDirectory]\Reports\Benchmark-Dark.png
var imgPath = DirectoryHelper.GetPathRelativeToProjectDirectory(@"Reports\Benchmark-Dark.png");
var options = new ReportHtmlOptions
{
Title = "Json Serializers Benchmark",
GroupByColumns = ["Method"], // Groups by 'Method' column and highlights groups
SpectrumColumns = ["Mean", "Allocated"], // Colorizes 'Mean' and 'Allocated' columns as Spectrum
DividerMode = RenderTableDividerMode.EmptyDividerRow, // Separates tables by Empty Divider Row
HtmlWrapMode = HtmlDocumentWrapMode.Simple, // Uses simple HTML table
Theme = Theme.Dark // Optional (Default is Dark)
};
await summary.SaveAsHtmlAndImageAsync(htmlPath, imgPath, options);
```
**Note: Use BenchmarkAutoRunner to Run your benchmarks**
Prefer to use **BenchmarkAutoRunner.Run()** instead of **BenchmarkRunner.Run()** to run your benchmarks.
`BenchmarkAutoRunner` is **similar** to `BenchmarkRunner`, but is **Smarter!**
```csharp
BenchmarkAutoRunner.Run();
// Instead of
//BenchmarkRunner.Run();
```
**Output HTML:**
Visit [this HTML page](https://mjebrahimi.github.io/BenchmarkDotNetVisualizer/docs/json-serializers-benchmark.html) at `samples/JsonSerializersBenchmark/Reports/Benchmark-Dark.html`
**Output Image:**

### 3. Or Using Exporters
**Note:** prefer to use previous (recommended) methods.
**Exporters:**
- **[RichImageExporter]**
- **[RichHtmlExporter]**
**Example:**
```csharp
BenchmarkAutoRunner.Run(); //Prefer to use BenchmarkAutoRunner instead of BenchmarkRunner
//Export to colorful image
[RichImageExporter(
title: "Json Serializers Benchmark",
groupByColumns: ["Method"], // Groups by 'Method' column and highlights groups
spectrumColumns: ["Mean", "Allocated"], // Colorizes 'Mean' and 'Allocated' columns as Spectrum and Sorts the result by them
//format: ImageFormat.Webp or Jpeg // You can set image format (Default is ImageFormat.Png)
//theme: Theme.Dark // Optional (Default is Dark)
)]
//Export to feature-rich HTML
[RichHtmlExporter(
title: "Json Serializers Benchmark",
groupByColumns: ["Method"], // Groups by 'Method' column and highlights groups
spectrumColumns: ["Mean", "Allocated"] // Colorizes 'Mean' and 'Allocated' columns as Spectrum and Sorts the result by them
//sortByColumns: ["Mean", "Allocated"] // You can also sort by other columns as you wish
//theme: Theme.Dark // Optional (Default is Dark)
)]
[MemoryDiagnoser(displayGenColumns: false)] // Displays Allocated column (without GC per Generation columns (Gen 0, Gen 1, Gen 2) due to false option)
public class JsonSerializersBenchmark { ... }
```
**Output:**
To see the results, navigate to the following path:
`[ProjectDirectory]\bin\[Debug|Release]\[.NET-version]\BenchmarkDotNet.Artifacts\results\Benchmark-report-rich.html|png`
**For Example:**
- `MyBenchmark\bin\Release\net8.0\BenchmarkDotNet.Artifacts\results\Benchmark-report-rich.png`
- `MyBenchmark\bin\Release\net8.0\BenchmarkDotNet.Artifacts\results\Benchmark-report-rich.html`
### Using JoinReports method to Join and Pivot your reports
**Example:**
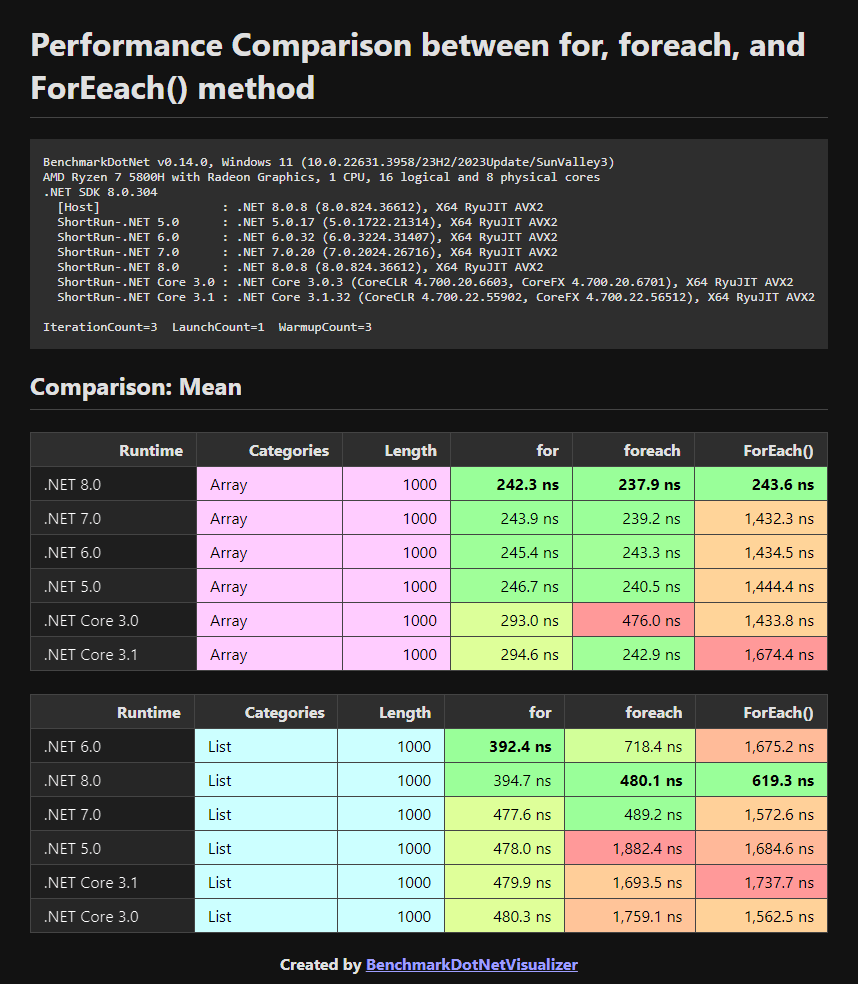
**Performance benchmark between for, foreach, and ForEach() in different versions of .NET**
#### Pivot by Method column
```csharp
var summary = BenchmarkAutoRunner.Run(); //Prefer to use BenchmarkAutoRunner instead of BenchmarkRunner
//[ProjectDirectory]\Reports\JoinedBenchmark-PivotBy-Method-Dark.html
var htmlPath = DirectoryHelper.GetPathRelativeToProjectDirectory(@"Reports\JoinedBenchmark-PivotBy-Method-Dark.html");
//[ProjectDirectory]\Reports\JoinedBenchmark-PivotBy-Method-Dark.png
var imagePath = DirectoryHelper.GetPathRelativeToProjectDirectory(@"Reports\JoinedBenchmark-PivotBy-Method-Dark.png");
var options = new JoinReportHtmlOptions
{
Title = "Performance Comparison between for, foreach, and ForEach() method",
MainColumn = "Runtime",
GroupByColumns = ["Categories", "Length"], // Groups by column 'Categories' and 'Length'
PivotColumn = "Method", // Pivot 'Method' column per value of 'Mean'
StatisticColumns = ["Mean"], // Colorizes 'Mean' columns as Spectrum
ColumnsOrder = ["for", "foreach", "ForEach()"], // Order of columns
DividerMode = RenderTableDividerMode.SeparateTables, // Separates tables by Grouping by 'GroupByColumns'
HtmlWrapMode = HtmlDocumentWrapMode.RichDataTables, // Uses feature-rich https://datatables.net plugin
Theme = Theme.Dark // Optional (Default is Dark)
};
await summary.JoinReportsAndSaveAsHtmlAndImageAsync(htmlPath, imagePath, options);
```
**Output HTML:**
Visit [this HTML page](https://mjebrahimi.github.io/BenchmarkDotNetVisualizer/docs/iteration-benchmark1.html) at `samples/IterationBenchmark/Reports/JoinedBenchmark-PivotBy-Method-Dark.html`
**Output Image:**
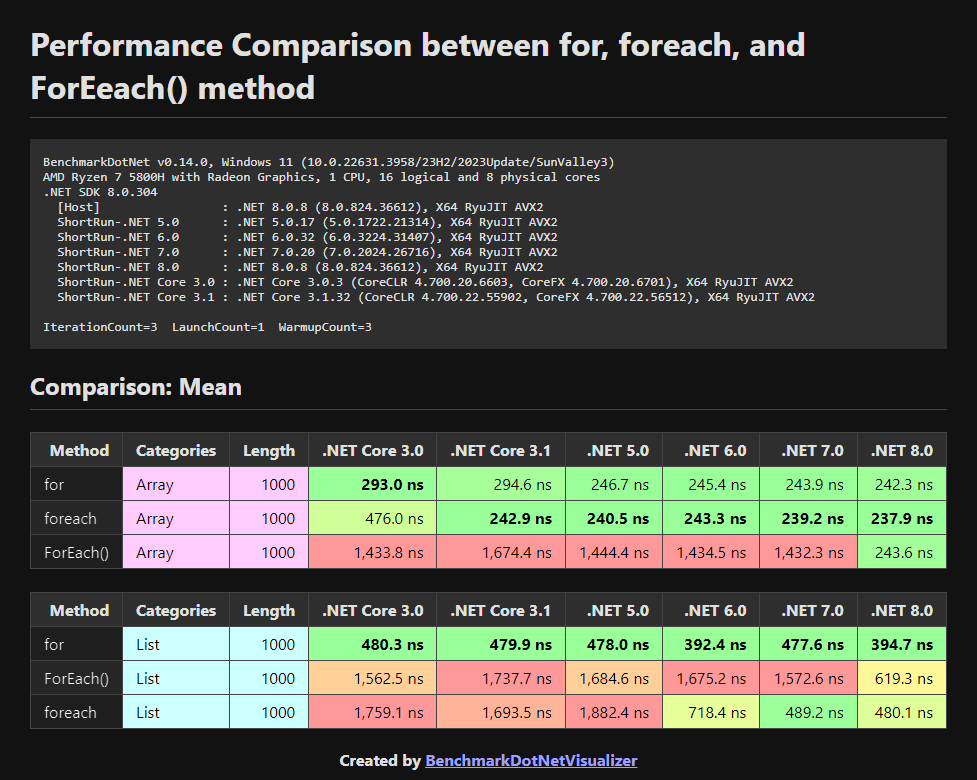
#### Pivot by .NET Runtime column
```csharp
var summary = BenchmarkAutoRunner.Run(); //Prefer to use BenchmarkAutoRunner instead of BenchmarkRunner
//[ProjectDirectory]\Reports\JoinedBenchmark-PivotBy-Runtime-Dark.html
var htmlPath = DirectoryHelper.GetPathRelativeToProjectDirectory(@"Reports\JoinedBenchmark-PivotBy-Runtime-Dark.html");
//[ProjectDirectory]\Reports\JoinedBenchmark-PivotBy-Runtime-Dark.png
var imagePath = DirectoryHelper.GetPathRelativeToProjectDirectory(@"Reports\JoinedBenchmark-PivotBy-Runtime-Dark.png");
var options = new JoinReportHtmlOptions
{
Title = "Performance Comparison between for, foreach, and ForEach() method",
MainColumn = "Method",
GroupByColumns = ["Categories", "Length"], // Groups by column 'Categories' and 'Length'
PivotColumn = "Runtime", // Pivot 'Runtime' column per value of 'Mean'
StatisticColumns = ["Mean"], // Colorizes 'Mean' columns as Spectrum
ColumnsOrder = [".NET Core 3.0", ".NET Core 3.1", ".NET 5.0", ".NET 6.0", ".NET 7.0", ".NET 8.0"], //Order of columns
DividerMode = RenderTableDividerMode.SeparateTables, // Separates tables by Grouping by 'GroupByColumns'
HtmlWrapMode = HtmlDocumentWrapMode.RichDataTables, // Uses feature-rich https://datatables.net plugin
Theme = Theme.Dark // Optional (Default is Dark)
};
await summary.JoinReportsAndSaveAsHtmlAndImageAsync(htmlPath, imagePath, options);
```
**Output HTML:**
Visit [this HTML page](https://mjebrahimi.github.io/BenchmarkDotNetVisualizer/docs/iteration-benchmark2.html) at `samples/IterationBenchmark/Reports/JoinedBenchmark-PivotBy-Runtime-Dark.html`
**Output Image:**
## Todo
- [ ] Chart Visualization
## Contributing
Create an [issue](https://github.com/mjebrahimi/BenchmarkDotNetVisualizer/issues/new) if you find a BUG or have a Suggestion or Question.
If you want to develop this project :
1. Fork it!
2. Create your feature branch: `git checkout -b my-new-feature`
3. Commit your changes: `git commit -am 'Add some feature'`
4. Push to the branch: `git push origin my-new-feature`
5. Submit a pull request
## Give it a Star! ⭐️
If you find this repository useful and like it, why not give it a star? if not, never mind! :)
## License
Copyright © 2024 [Mohammad Javad Ebrahimi](https://github.com/mjebrahimi) under the [MIT License](https://github.com/mjebrahimi/BenchmarkDotNetVisualizer/LICENSE).