https://github.com/moshi4/cafeplotter
A tool for plotting CAFE5 gene family expansion/contraction result
https://github.com/moshi4/cafeplotter
bioinformatics evolution matplotlib molecular-evolution phylogenetic-trees phylogenetics phylogenomics python
Last synced: about 1 year ago
JSON representation
A tool for plotting CAFE5 gene family expansion/contraction result
- Host: GitHub
- URL: https://github.com/moshi4/cafeplotter
- Owner: moshi4
- License: mit
- Created: 2023-03-03T11:12:01.000Z (over 3 years ago)
- Default Branch: main
- Last Pushed: 2023-09-22T12:59:03.000Z (almost 3 years ago)
- Last Synced: 2024-04-26T02:04:52.961Z (about 2 years ago)
- Topics: bioinformatics, evolution, matplotlib, molecular-evolution, phylogenetic-trees, phylogenetics, phylogenomics, python
- Language: Python
- Homepage:
- Size: 3.77 MB
- Stars: 19
- Watchers: 3
- Forks: 3
- Open Issues: 0
-
Metadata Files:
- Readme: README.md
- License: LICENSE
Awesome Lists containing this project
README
# CafePlotter


[](https://pypi.python.org/pypi/cafeplotter)
[](https://github.com/moshi4/CafePlotter/actions/workflows/ci.yml)
## Table of contents
- [Overview](#overview)
- [Installation](#installation)
- [Usage](#usage)
- [Output Contents](#output-contents)
## Overview
CAFE (Computational Analysis of gene Family Evolution) is a software to analyze changes in gene family size in a way
that accounts for phylogenetic history and provides a statistical foundation for evolutionary inferences.
[CAFE5](https://github.com/hahnlab/CAFE5) currently does not provide tools to visualize Expansion/Contraction of gene families on phylogenetic tree.
To solve this issue, I developed CafePlotter, a tool for plotting CAFE5 gene family expansion/contraction result.
## Installation
`Python 3.8 or later` is required for installation.
**Install PyPI package:**
pip install cafeplotter
## Usage
### Basic Command
cafeplotter -i [CAFE5 result directory] -o [Output directory]
### Options
General Options:
-i IN, --indir IN CAFE5 result directory as input
-o OUT, --outdir OUT Output directory for plotting CAFE5 result
--format Output image format ('png'[default]|'jpg'|'svg'|'pdf')
-v, --version Print version information
-h, --help Show this help message and exit
Figure Appearence Options:
--fig_height Figure height per leaf node of tree (Default: 0.5)
--fig_width Figure width (Default: 8.0)
--leaf_label_size Leaf label size (Default: 12)
--count_label_size Gene count label size (Default: 8)
--innode_label_size Internal node label size (Default: 0)
--p_label_size Branch p-value label size (Default: 0)
--ignore_branch_length Ignore branch length for plotting tree (Default: OFF)
--expansion_color Plot color of gene family expansion (Default: 'red')
--contraction_color Plot color of gene family contraction (Default: 'blue')
--dpi Figure DPI (Default: 300)
### Example Command
User can download example dataset ([singlelambda.zip](https://github.com/moshi4/CafePlotter/raw/main/examples/singlelambda.zip)):
cafeplotter -i ./examples/singlelambda -o ./singlelambda_plot --ignore_branch_length
## Output Contents
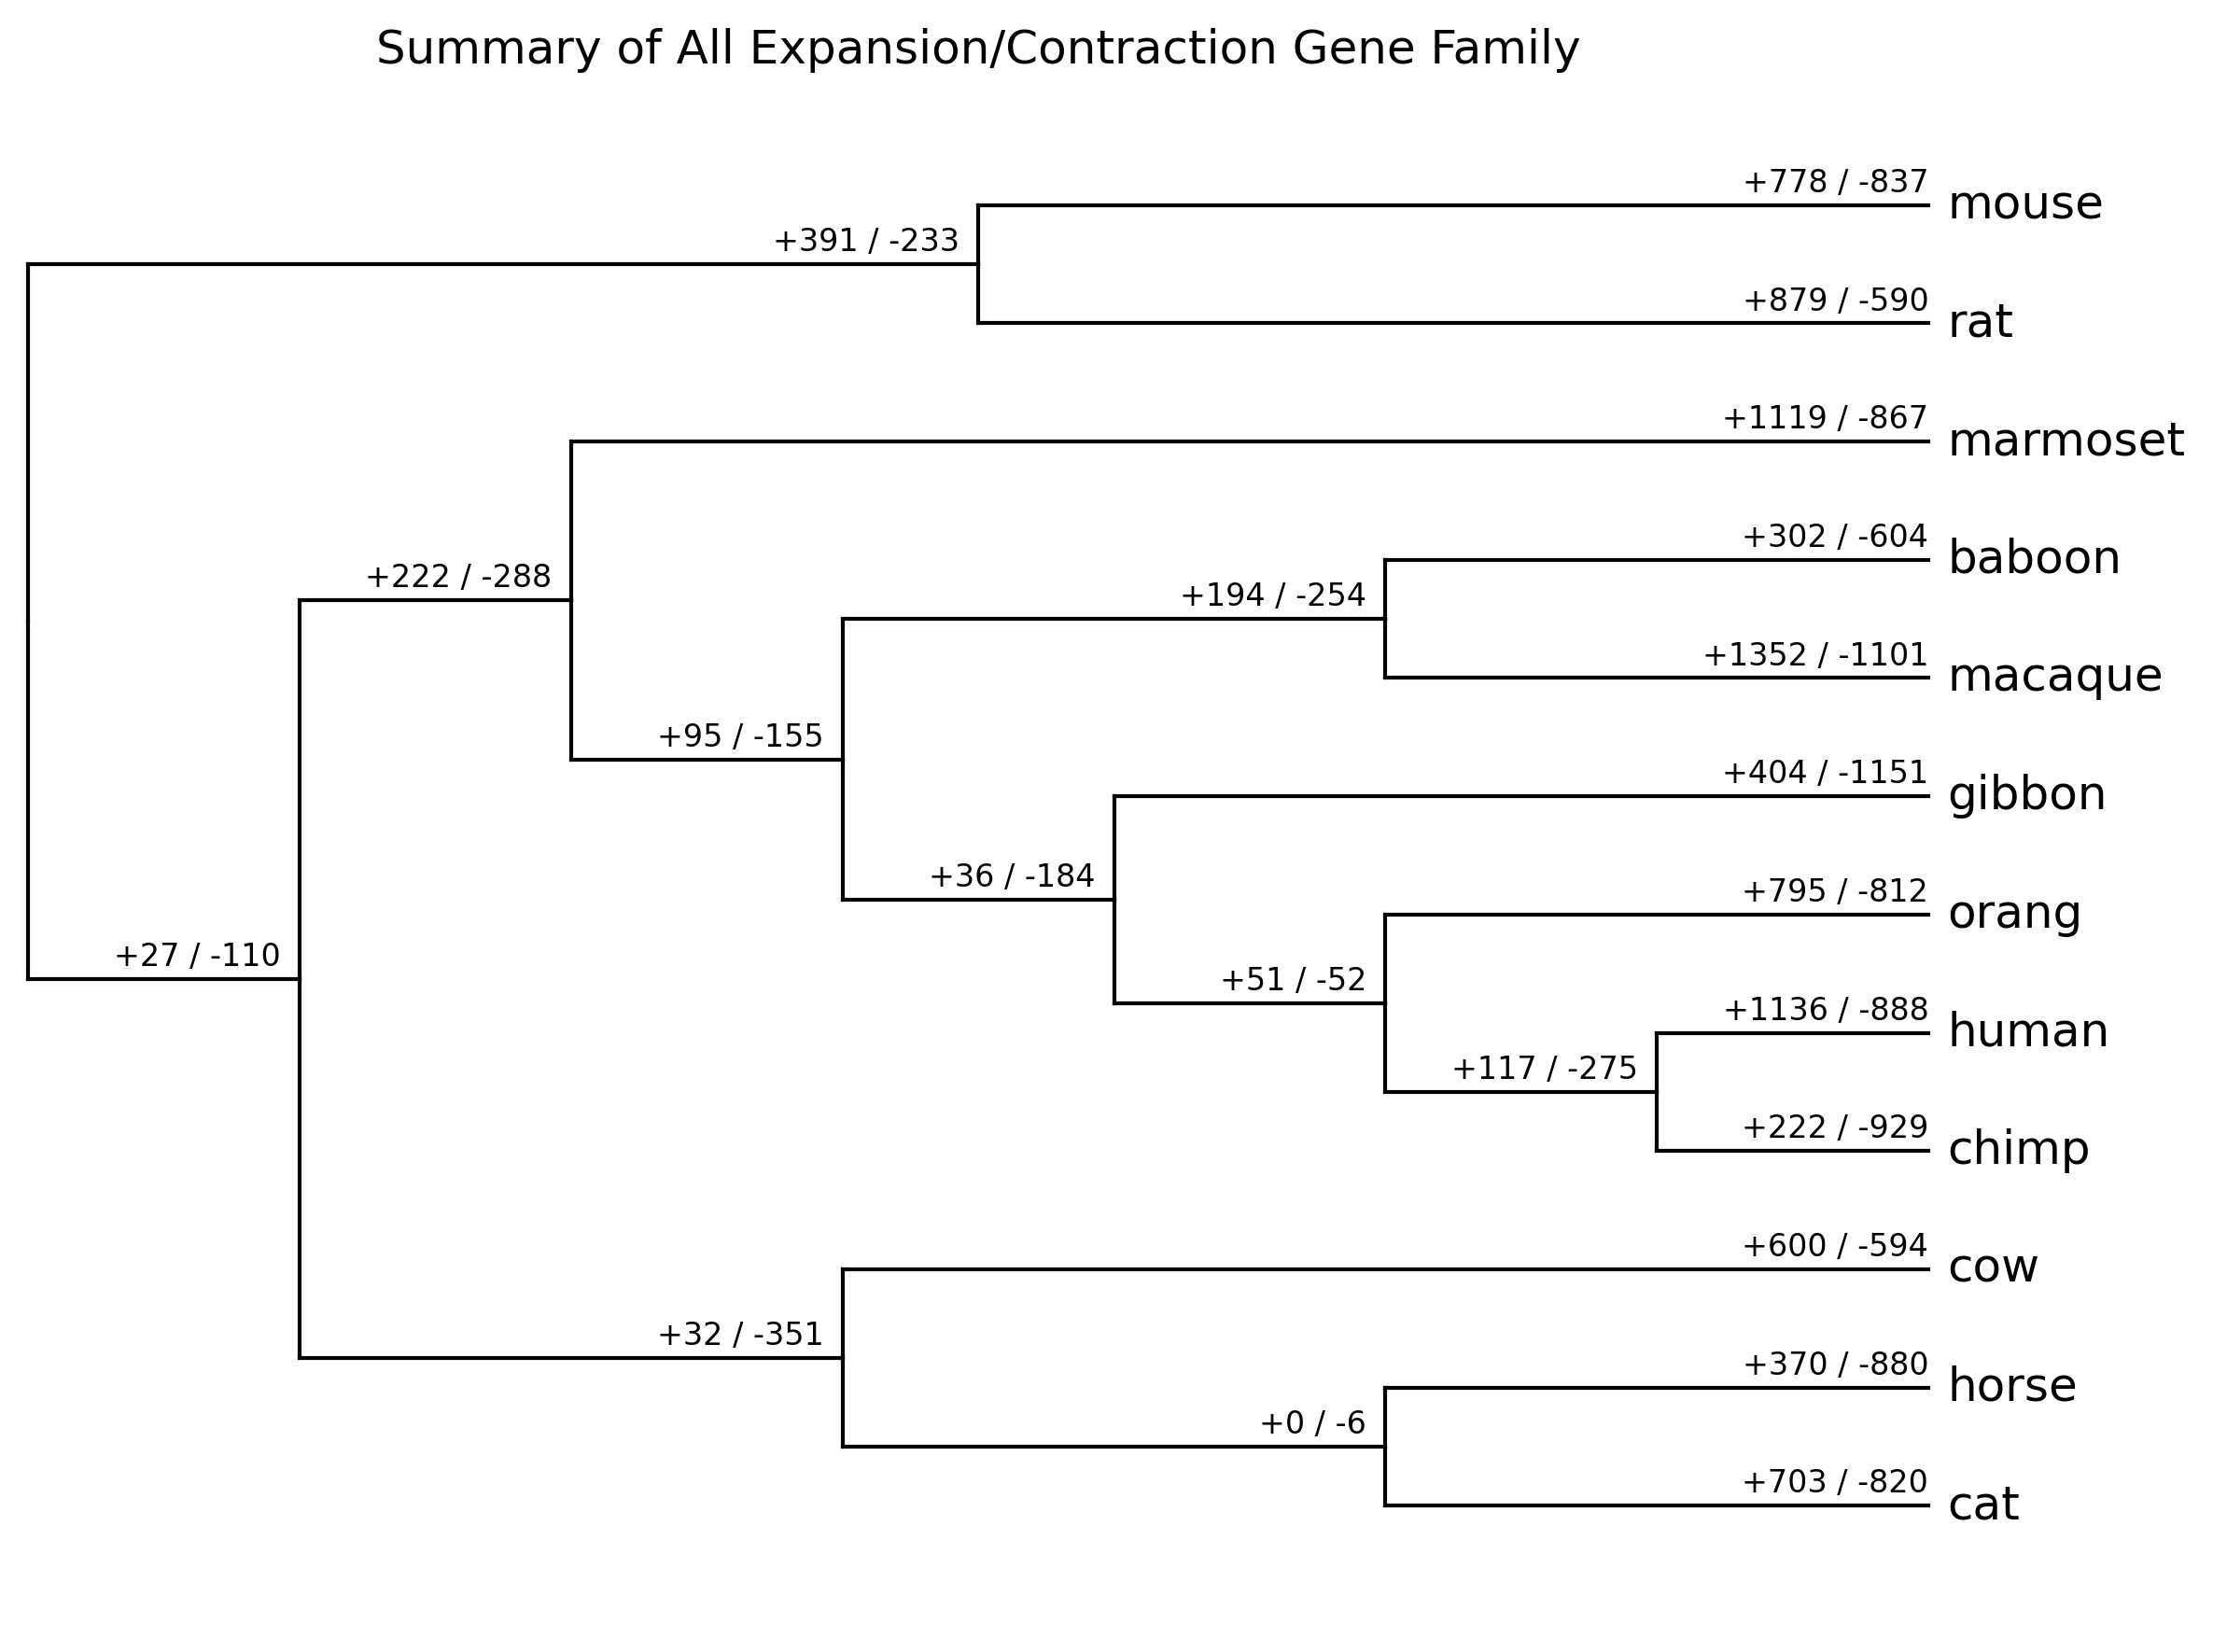
- **summary_all_gene_family.[png|jpg|svg|pdf]**
Summary of all expansion/contraction gene family result (from `*_clade_result.txt`)
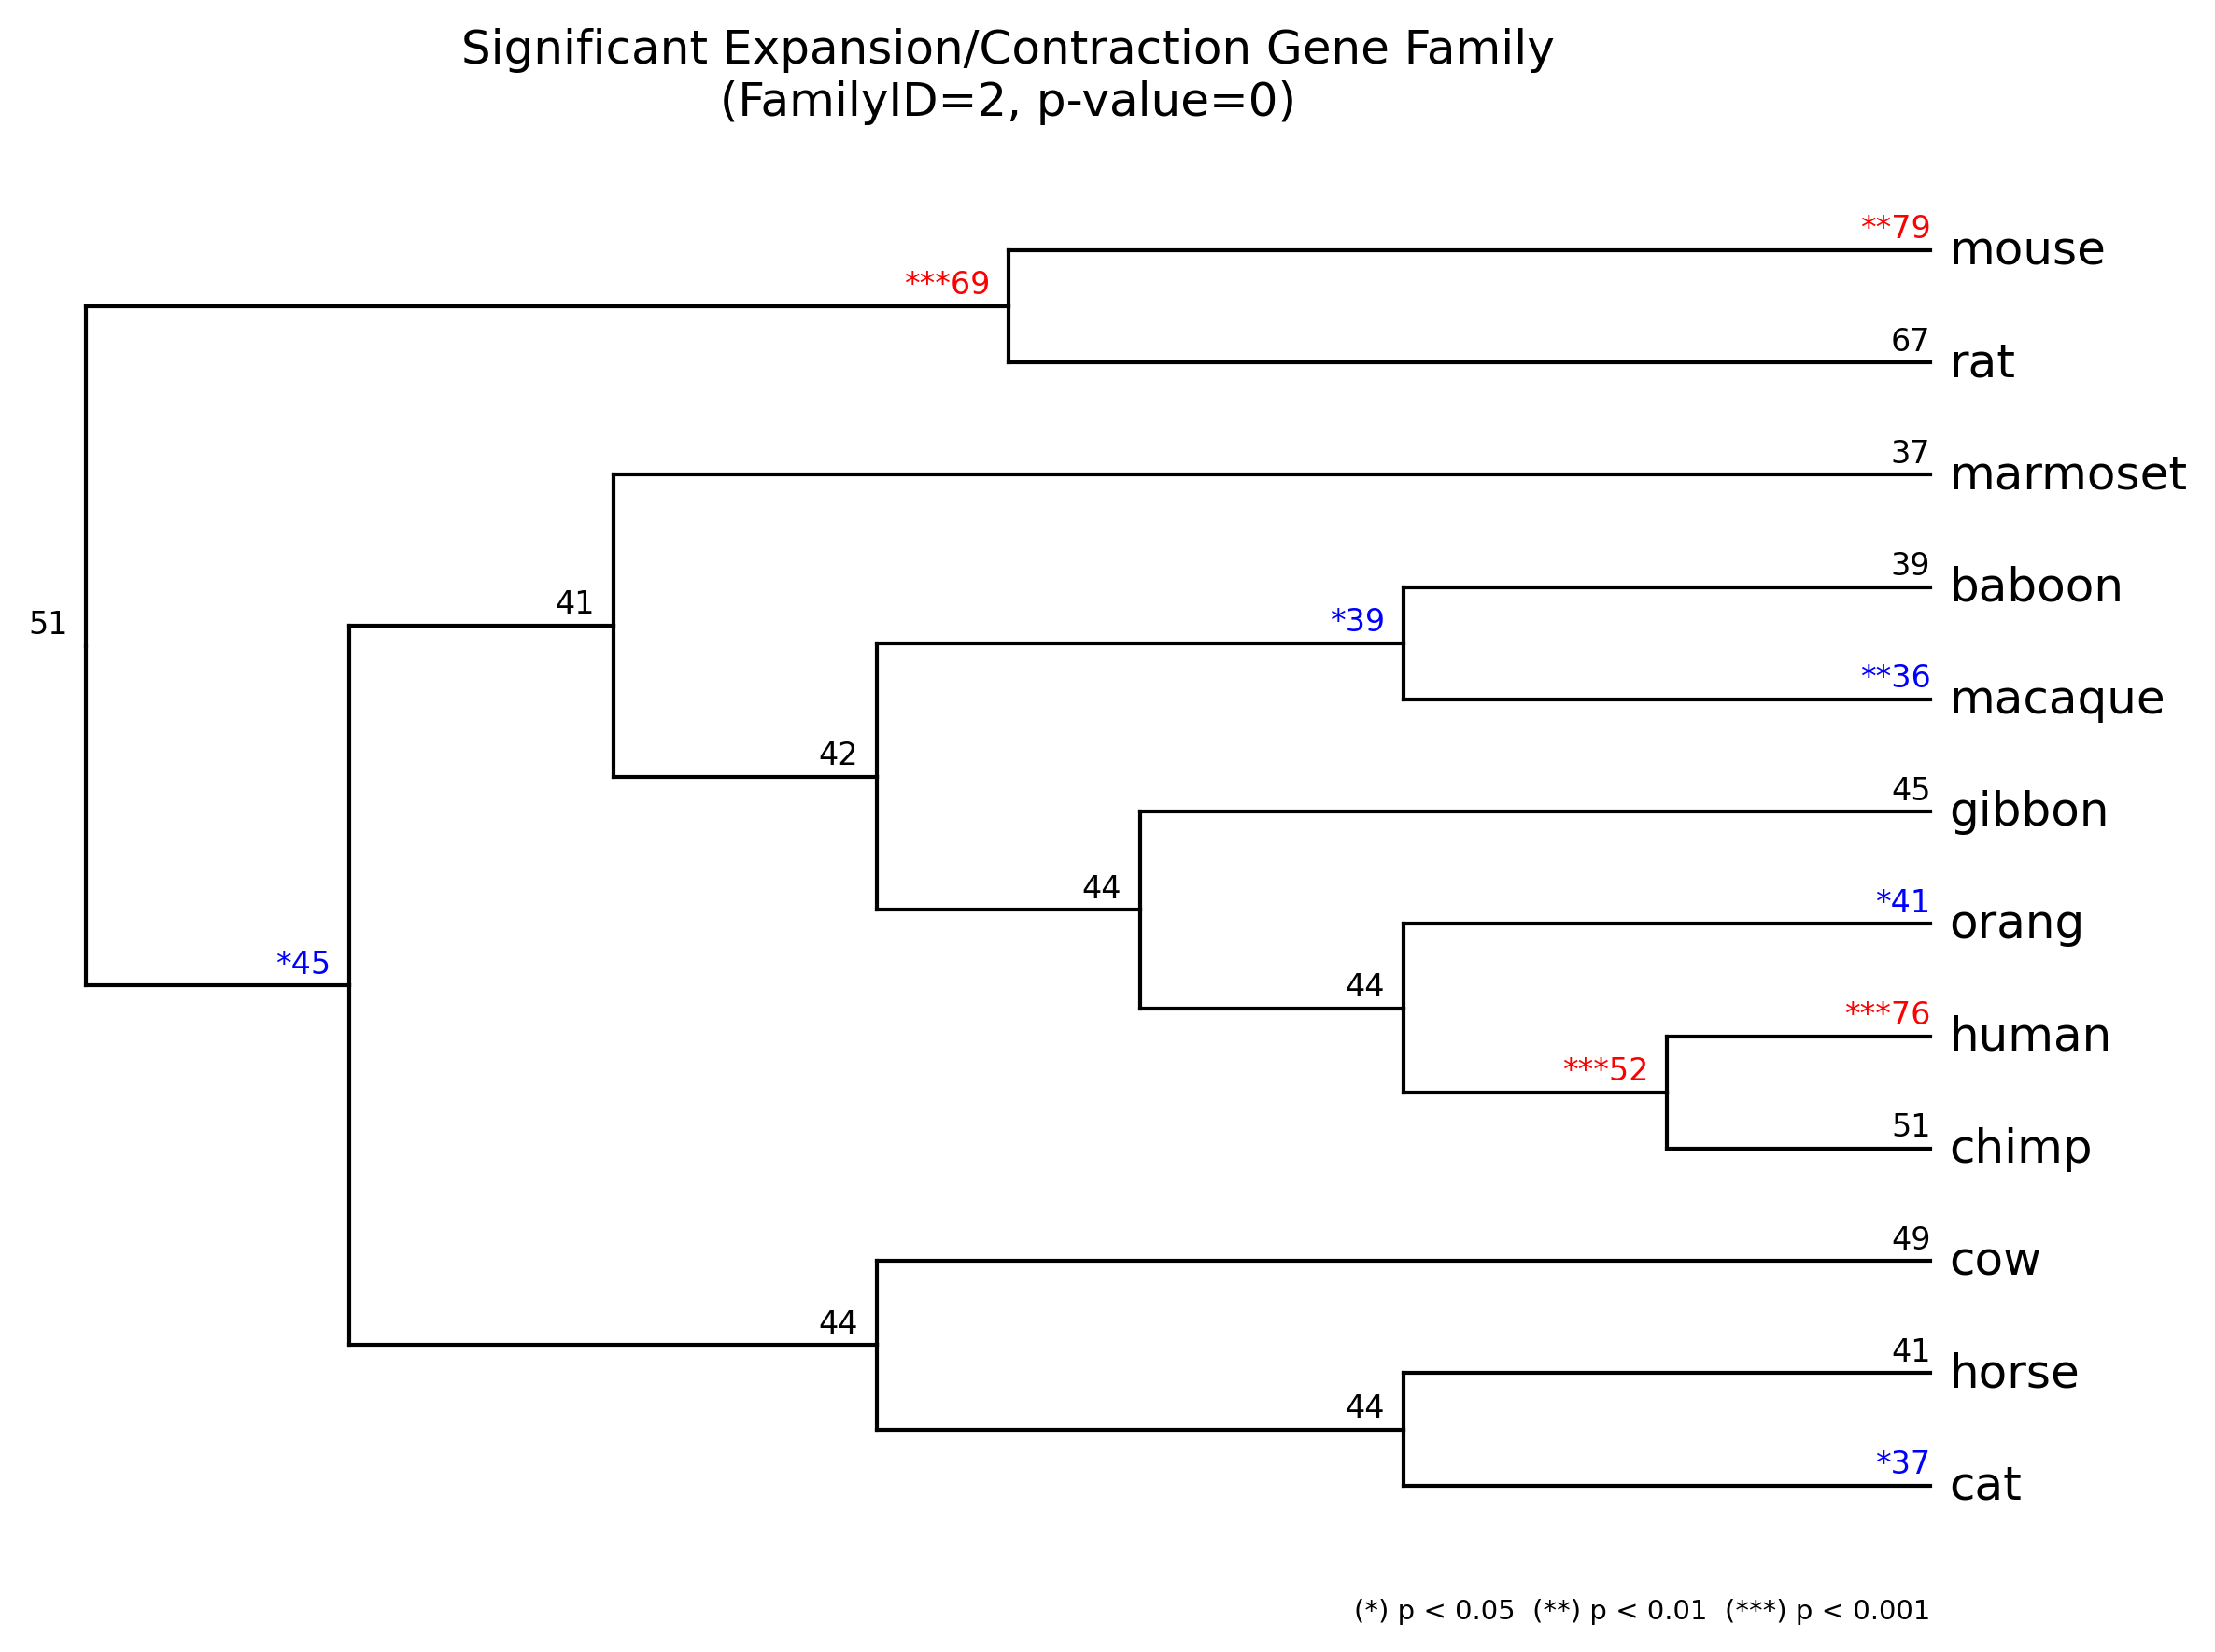
- **gene_family/{FamilyID}_gene_family.[png|jpg|svg|pdf]**
Significant expansion(*red*)/contraction(*blue*) gene family result
- **result_summary.tsv** ([example](https://raw.githubusercontent.com/moshi4/CafePlotter/main/examples/result_summary.tsv))
Significant expansion/contraction result summary for each family and taxon