https://github.com/moshi4/cogclassifier
A tool for classifying prokaryote protein sequences into COG(Cluster of Orthologous Genes) functional category
https://github.com/moshi4/cogclassifier
bioinformatics cog comparative-genomics functional-analysis functional-annotation genome-analysis genomics microbial-genomics protein python visualization
Last synced: about 1 year ago
JSON representation
A tool for classifying prokaryote protein sequences into COG(Cluster of Orthologous Genes) functional category
- Host: GitHub
- URL: https://github.com/moshi4/cogclassifier
- Owner: moshi4
- License: mit
- Created: 2022-03-18T07:48:59.000Z (over 4 years ago)
- Default Branch: main
- Last Pushed: 2025-05-03T06:14:36.000Z (about 1 year ago)
- Last Synced: 2025-05-12T13:13:14.921Z (about 1 year ago)
- Topics: bioinformatics, cog, comparative-genomics, functional-analysis, functional-annotation, genome-analysis, genomics, microbial-genomics, protein, python, visualization
- Language: Python
- Homepage:
- Size: 33.6 MB
- Stars: 65
- Watchers: 2
- Forks: 6
- Open Issues: 0
-
Metadata Files:
- Readme: README.md
- License: LICENSE
- Citation: CITATION.cff
Awesome Lists containing this project
README
# COGclassifier


[](https://pypi.python.org/pypi/cogclassifier)
[](https://anaconda.org/bioconda/cogclassifier)

## Table of Contents
- [Overview](#overview)
- [Installation](#installation)
- [Workflow](#workflow)
- [Usage](#usage)
- [Output Contents](#output-contents)
- [Customize Charts](#customize-charts)
## Overview
COG(Cluster of Orthologous Genes) is a database that plays an important role in the annotation, classification, and analysis of microbial gene function.
Functional annotation, classification, and analysis of each gene in newly sequenced bacterial genomes using the COG database is a common task.
However, there was no COG functional classification command line software that is easy-to-use and capable of producing publication-ready figures.
Therefore, I developed COGclassifier to fill this need.
COGclassifier can automatically perform the processes from searching query sequences into the COG database, to annotation and classification of gene functions, to generation of publication-ready figures (See figure below).
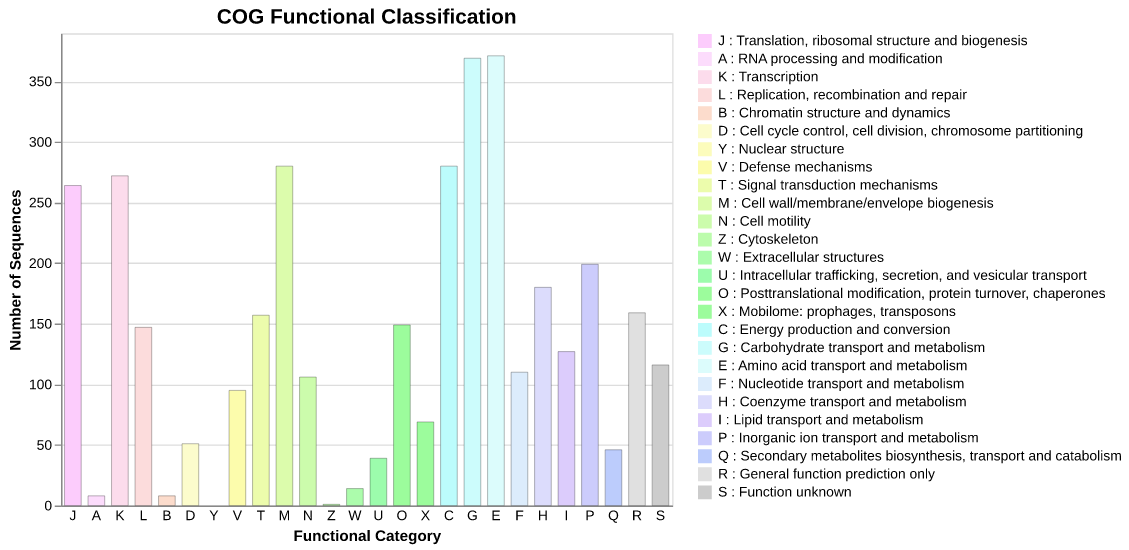
Fig.1: Barchart of COG funcitional category classification result for E.coli
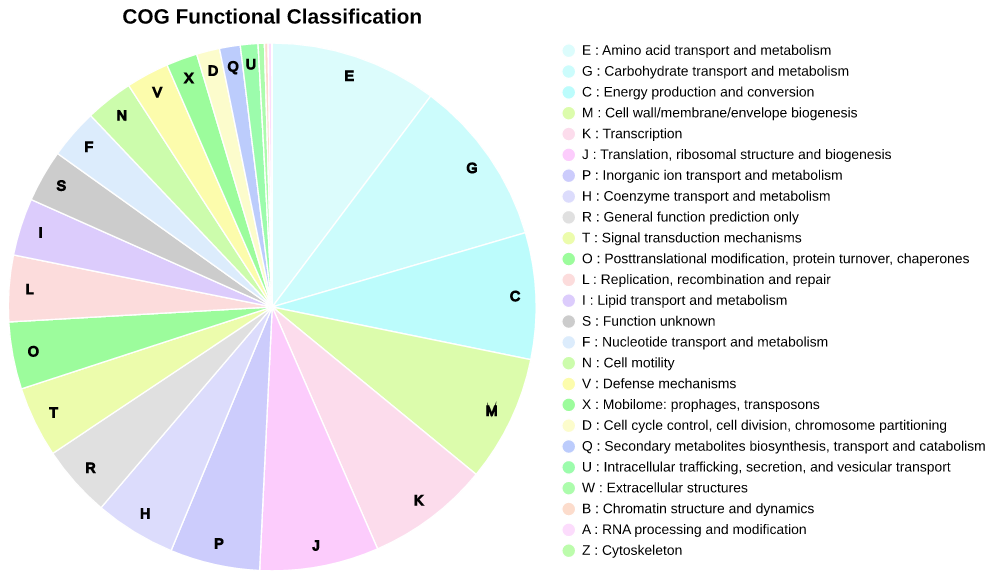
Fig.2: Piechart of COG funcitional category classification result for E.coli
## Installation
`Python 3.9 or later` is required for installation. Installation of RPS-BLAST(ncbi-blast+) is also necessary.
**Install bioconda package:**
conda install -c conda-forge -c bioconda cogclassifier
**Install PyPI stable package:**
pip install cogclassifier
## Workflow
Description of COGclassifier's automated workflow.
This workflow was created based in part on [cdd2cog](https://github.com/aleimba/bac-genomics-scripts/tree/master/cdd2cog).
### 1. Setup COG & CDD resources
Download & load 4 required COG & CDD files from FTP site.
- `cog-24.fun.tab` ()
Descriptions of COG functional categories.
This resource file is included in the package as `cog_func_category.tsv`.
Show more information
> Tab-delimited plain text file with descriptions of COG functional categories
> The categories form four functional groups:
> 1\. INFORMATION STORAGE AND PROCESSING
> 2\. CELLULAR PROCESSES AND SIGNALING
> 3\. METABOLISM
> 4\. POORLY CHARACTERIZED
> Columns:
> 1\. Functional category ID (one letter)
> 2\. Functional group (1-4, as above)
> 3\. Hexadecimal RGB color associated with the functional category
> 4\. Functional category description
> Each line corresponds to one functional category. The order of the categories is meaningful (reflects a hierarchy of functions; determines the order of display)
>
> (From )
- `cog-24.def.tab` ()
COG descriptions such as 'COG ID', 'COG functional category', 'COG name', etc...
This resource file is included in the package as `cog_definition.tsv`.
Show more information
> Tab-delimited plain text file with COG descriptions
> Columns:
> 1\. COG ID
> 2\. COG functional category (could include multiple letters in the order of importance)
> 3\. COG name
> 4\. Gene name associated with the COG (optional)
> 5\. Functional pathway associated with the COG (optional)
> 6\. PubMed ID, associated with the COG (multiple entries are semicolon-separated; optional)
> 7\. PDB ID of the structure associated with the COG (multiple entries are semicolon-separated; optional)
> Each line corresponds to one COG. The order of the COGs is arbitrary (displayed in the lexicographic order)
>
> (From )
- `cddid.tbl.gz` ()
Summary information about the CD(Conserved Domain) model.
Show more information
>"cddid.tbl.gz" contains summary information about the CD models in this
>distribution, which are part of the default "cdd" search database and are
>indexed in NCBI's Entrez database. This is a tab-delimited text file, with a
>single row per CD model and the following columns:
>
>PSSM-Id (unique numerical identifier)
>CD accession (starting with 'cd', 'pfam', 'smart', 'COG', 'PRK' or "CHL')
>CD "short name"
>CD description
>PSSM-Length (number of columns, the size of the search model)
>
> (From )
- `Cog_LE.tar.gz` ()
COG database, a part of CDD(Conserved Domain Database), for RPS-BLAST search.
### 2. RPS-BLAST search against COG database
Run query sequences RPS-BLAST against COG database [Default: E-value = 1e-2].
Best-hit (=lowest e-value) blast results are extracted and used in next functional classification step.
### 3. Classify query sequences into COG functional category
From best-hit results, extract relationship between query sequences and COG functional category as described below.
1. Best-hit results -> CDD ID
2. CDD ID -> COG ID (From `cddid.tbl.gz`)
3. COG ID -> COG Functional Category Letter (From `cog-24.def.tab`)
4. COG Functional Category Letter -> COG Functional Category Definition (From `cog-24.fun.tab`)
> :warning:
> If functional category with multiple letters exists, first letter is treated as functional category
> (e.g. COG4862 has multiple letters `KTN`. A letter `K` is treated as functional category).
Using the above information, the number of query sequences classified into each COG functional category is calculated and
functional annotation and classification results are output.
## Usage
### Basic Command
COGclassifier -i [protein fasta file] -o [output directory]
### Options
$ COGclassifier --help
Usage: COGclassifier [OPTIONS]
A tool for classifying prokaryote protein sequences into COG functional category
╭─ Options ──────────────────────────────────────────────────────────────────────────────────────────────────────────╮
│ * --infile -i Input query protein fasta file [required] │
│ * --outdir -o Output directory [required] │
│ --download_dir -d Download COG & CDD resources directory [default: /home/user/.cache/cogclassifier_v2] │
│ --thread_num -t RPS-BLAST num_thread parameter [default: MaxThread - 1] │
│ --evalue -e RPS-BLAST e-value parameter [default: 0.01] │
│ --quiet -q No print log on screen │
│ --version -v Print version information │
│ --help -h Show this message and exit. │
╰────────────────────────────────────────────────────────────────────────────────────────────────────────────────────╯
### Example Command
Click [here](https://github.com/moshi4/COGclassifier/raw/main/example/example.zip) to download example protein fasta files.
COGclassifier -i ./example/ecoli.faa -o ./ecoli_cogclassifier
## Output Contents
- **`rpsblast.tsv`** ([example](https://github.com/moshi4/COGclassifier/blob/main/example/output/mycoplasma/rpsblast.tsv))
RPS-BLAST against COG database result (format = `outfmt 6`).
- **`cog_classify.tsv`** ([example](https://github.com/moshi4/COGclassifier/blob/main/example/output/mycoplasma/cog_classify.tsv))
Query sequences classified into COG functional category result.
This file contains all classified query sequences and associated COG information.
Table of detailed tsv format information (9 columns)
| Columns | Contents | Example Value |
| ---------------- | -------------------------------------- | ----------------------------------- |
| QUERY_ID | Query ID | NP_414544.1 |
| COG_ID | COG ID of RPS-BLAST top hit result | COG0083 |
| CDD_ID | CDD ID of RPS-BLAST top hit result | 223161 |
| EVALUE | RPS-BLAST top hit evalue | 2.5e-150 |
| IDENTITY | RPS-BLAST top hit identity | 45.806 |
| GENE_NAME | Abbreviated gene name | ThrB |
| COG_NAME | COG gene name | Homoserine kinase |
| COG_LETTER | Letter of COG functional category | E |
| COG_DESCRIPTION | Description of COG functional category | Amino acid transport and metabolism |
- **`cog_count.tsv`** ([example](https://github.com/moshi4/COGclassifier/blob/main/example/output/ecoli/cog_count.tsv))
Count classified sequences per COG functional category result.
Table of detailed tsv format information (5 columns)
| Columns | Contents | Example Value |
| ------------| --------------------------------------- | ----------------------------------------------- |
| LETTER | Letter of COG functional category | J |
| COUNT | Count of COG classified sequence | 259 |
| GROUP | COG functional group | INFORMATION STORAGE AND PROCESSING |
| COLOR | Symbol color of COG functional category | #FCCCFC |
| DESCRIPTION | Description of COG functional category | Translation, ribosomal structure and biogenesis |
- **`cogclassifier.log`** ([example](https://github.com/moshi4/COGclassifier/blob/main/example/output/ecoli/cogclassifier.log))
COGclassifier log file.
- **`cog_count_barchart.[png|html]`**
Barchart of COG funcitional category classification result.
COGclassifier uses [`Altair`](https://altair-viz.github.io/) visualization library for plotting charts.

- **`cog_count_piechart.[png|html]`**
Piechart of COG funcitional category classification result.
Functional category with percentages less than 1% don't display letter on piechart.

## Customize Charts
COGclassifier also provides barchart & piechart plotting API/CLI to customize charts appearence.
See [notebooks](https://github.com/moshi4/COGclassifier/blob/main/example/plot/plot_example.ipynb) and command below for details.
### plot_cog_count_barchart
$ plot_cog_count_barchart --help
Usage: plot_cog_count_barchart [OPTIONS]
Plot COGclassifier count barchart figure
╭─ Options ───────────────────────────────────────────────────────────────────────────────────╮
│ * --infile -i Input COG count result file ('cog_count.tsv') [required] │
│ * --outfile -o Output barchart figure file (*.png|*.svg|*.html) [required] │
│ --width Figure pixel width [default: 440] │
│ --height Figure pixel height [default: 340] │
│ --bar_width Figure bar width [default: 15] │
│ --y_limit Y-axis max limit value │
│ --percent_style Plot percent style instead of number count │
│ --sort Enable descending sort by number count │
│ --dpi Figure DPI [default: 100] │
│ --help -h Show this message and exit. │
╰─────────────────────────────────────────────────────────────────────────────────────────────╯
### plot_cog_count_piechart
$ plot_cog_count_piechart --help
Usage: plot_cog_count_piechart [OPTIONS]
Plot COGclassifier count piechart figure
╭─ Options ───────────────────────────────────────────────────────────────────────────────────╮
│ * --infile -i Input COG count result file ('cog_count.tsv') [required] │
│ * --outfile -o Output piechart figure file (*.png|*.svg|*.html) [required] │
│ --width Figure pixel width [default: 380] │
│ --height Figure pixel height [default: 380] │
│ --show_letter Show functional category lettter on piechart │
│ --sort Enable descending sort by number count │
│ --dpi Figure DPI [default: 100] │
│ --help -h Show this message and exit. │
╰─────────────────────────────────────────────────────────────────────────────────────────────╯