https://github.com/moshi4/gbkviz
Easy-to-use web application for visualization and comparison of genomes in Genbank file
https://github.com/moshi4/gbkviz
bioinformatics biopython comparative-genomics genbank genomics genomics-visualization microbial-genomics python streamlit visualization webapp
Last synced: 4 months ago
JSON representation
Easy-to-use web application for visualization and comparison of genomes in Genbank file
- Host: GitHub
- URL: https://github.com/moshi4/gbkviz
- Owner: moshi4
- License: mit
- Archived: true
- Created: 2021-11-12T08:08:11.000Z (over 3 years ago)
- Default Branch: main
- Last Pushed: 2022-05-27T09:58:50.000Z (almost 3 years ago)
- Last Synced: 2025-01-16T07:56:19.623Z (4 months ago)
- Topics: bioinformatics, biopython, comparative-genomics, genbank, genomics, genomics-visualization, microbial-genomics, python, streamlit, visualization, webapp
- Language: Python
- Homepage:
- Size: 5.25 MB
- Stars: 21
- Watchers: 2
- Forks: 4
- Open Issues: 0
-
Metadata Files:
- Readme: README.md
- License: LICENSE
- Citation: CITATION.cff
Awesome Lists containing this project
README
# GBKviz: Genbank Data Visualization WebApp
[](https://share.streamlit.io/moshi4/gbkviz/main/src/gbkviz/gbkviz_webapp.py)


[](https://pypi.python.org/pypi/gbkviz)
[](https://anaconda.org/bioconda/gbkviz)
[](https://github.com/moshi4/GBKviz/actions/workflows/ci.yml)
## Overview
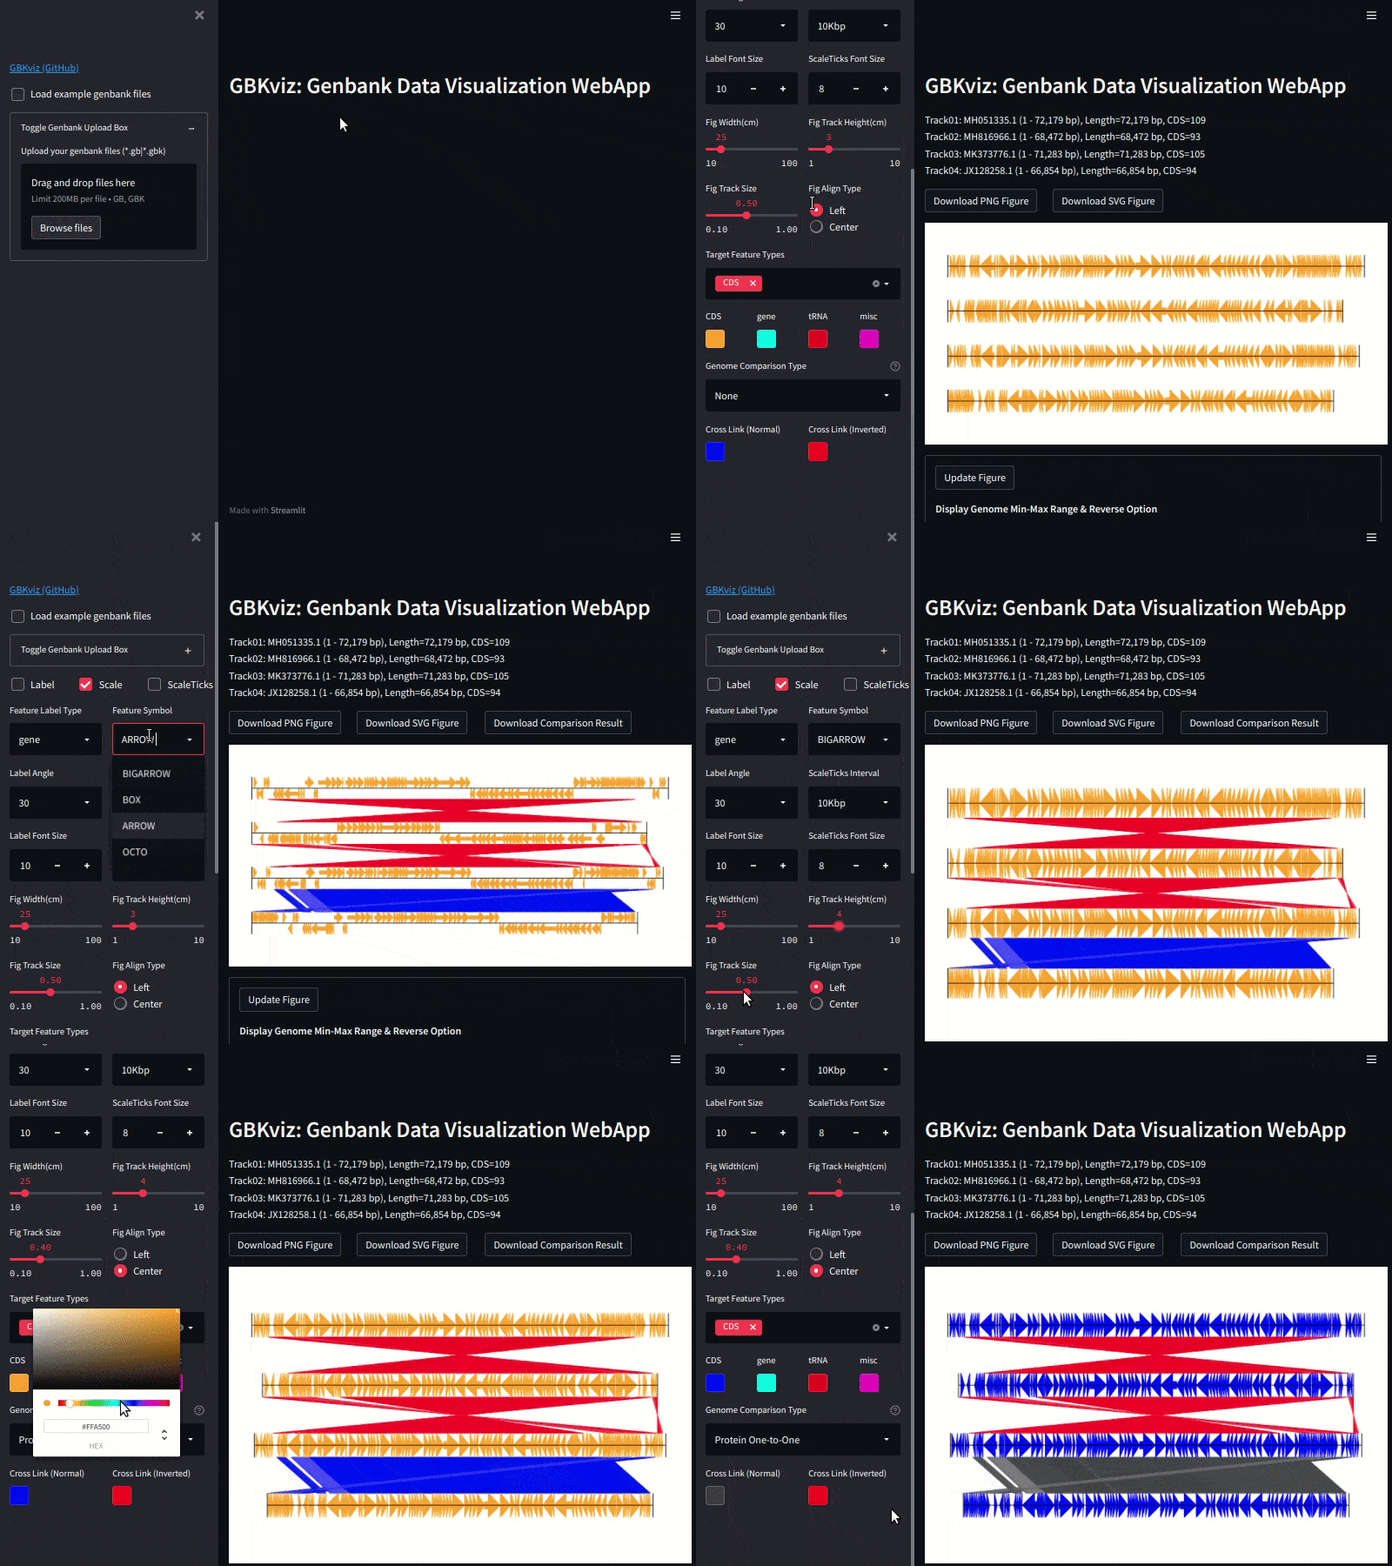
GBKviz is a web-based Genbank data visualization and comparison tool developed with streamlit web framework.
GBKviz allows user to easily and flexibly draw CDSs in user-specified genomic region (PNG or SVG format is available).
It also supports drawing genome comparison results by MUMmer.
GenomeDiagram, a part of BioPython module, is used to draw the diagram.
This software is developed under the strong inspiration of [EasyFig](https://mjsull.github.io/Easyfig/).

If you are interested, click [here](https://share.streamlit.io/moshi4/gbkviz/main/src/gbkviz/gbkviz_webapp.py) to try GBKviz on Streamlit Cloud.
>:warning: Due to the limited resources in Streamlit Cloud, it may be unstable.
> When performing comparative analysis of users' genomic data, use the stable, locally installed version.
## Installation
GBKviz is implemented in Python3. MUMmer is required for genome comparison.
**Install bioconda package:**
conda install -c bioconda -c conda-forge gbkviz
**Install PyPI package:**
pip install gbkviz
**Use Docker ([Docker Image](https://hub.docker.com/r/moshi4/gbkviz/tags)):**
docker pull moshi4/gbkviz:latest
docker run -d -p 8501:8501 moshi4/gbkviz:latest
## Dependencies
- [Streamlit](https://streamlit.io/)
Simple web framework for data analysis
- [BioPython](https://github.com/biopython/biopython)
Utility tools for computational molecular biology
- [MUMmer](https://github.com/mummer4/mummer)
Genome alignment tool for comparative genomics
## Command Usage
Launch GBKviz in web browser ():
gbkviz_webapp
If you are using Docker to start, above command is already executed.
## Example
Example of GBKviz genome comparison and visualization results.

Fig.1: 4 phage whole genomes comparison result

Fig.2: 4 E.coli partial genomes comparison result

Fig.3: 4 E.coli whole genomes comparison result

Fig.4: Simple CDS visualization with gene label
## Genome Comparison
In GBKviz, [MUMmer](https://github.com/mummer4/mummer) is used as genome comparison tool.
Following four genome comparison methods are available.
- Nucleotide One-to-One Mapping
- Nucleotide Many-to-Many Mapping
- Protein One-to-One Mapping
- Protein Many-to-Many Mapping
User can download and check genome comparison results file.
Genome comparison results file is in the following tsv format.
| Columns | Contents |
| ------------ | --------------------------------------------------- |
| REF_START | Reference genome alignment start position |
| REF_END | Reference genome alignment end position |
| QUERY_START | Query genome alignment start position |
| QUERY_END | Query genome alignment end position |
| REF_LENGTH | Reference genome alignment length |
| QUERY_LENGTH | Query genome alignment length |
| IDENTITY | Reference and query genome alignment identity (%) |
| REF_NAME | Reference genome name tag |
| QUERY_NAME | Query genome name tag |