https://github.com/mrtazz/yagd
super simple dashboard framework in PHP
https://github.com/mrtazz/yagd
Last synced: about 1 year ago
JSON representation
super simple dashboard framework in PHP
- Host: GitHub
- URL: https://github.com/mrtazz/yagd
- Owner: mrtazz
- License: mit
- Created: 2014-05-24T16:55:48.000Z (about 12 years ago)
- Default Branch: master
- Last Pushed: 2016-06-21T02:39:49.000Z (about 10 years ago)
- Last Synced: 2025-04-15T15:12:06.669Z (about 1 year ago)
- Language: PHP
- Homepage: http://code.mrtazz.com/yagd/
- Size: 68.4 KB
- Stars: 9
- Watchers: 4
- Forks: 2
- Open Issues: 0
-
Metadata Files:
- Readme: README.md
- Changelog: CHANGELOG.md
- Contributing: CONTRIBUTING.md
- License: LICENSE
Awesome Lists containing this project
README
# yagd
[](https://travis-ci.org/mrtazz/yagd)
[](https://coveralls.io/github/mrtazz/yagd?branch=master)
[](https://codeclimate.com/github/mrtazz/yagd)
[](https://packagist.org/packages/mrtazz/yagd)
[](https://packagist.org/packages/mrtazz/yagd) [](http://opensource.org/licenses/MIT)
## Overview
Yet Another Graphite Dashboard - because why not? It's heavily inspired by
[the Etsy dashboard framework](https://github.com/etsy/dashboard) but only
provides a very small subset of features. If you have a lot of hosts or need
advanced features I'd recommend checking that out.
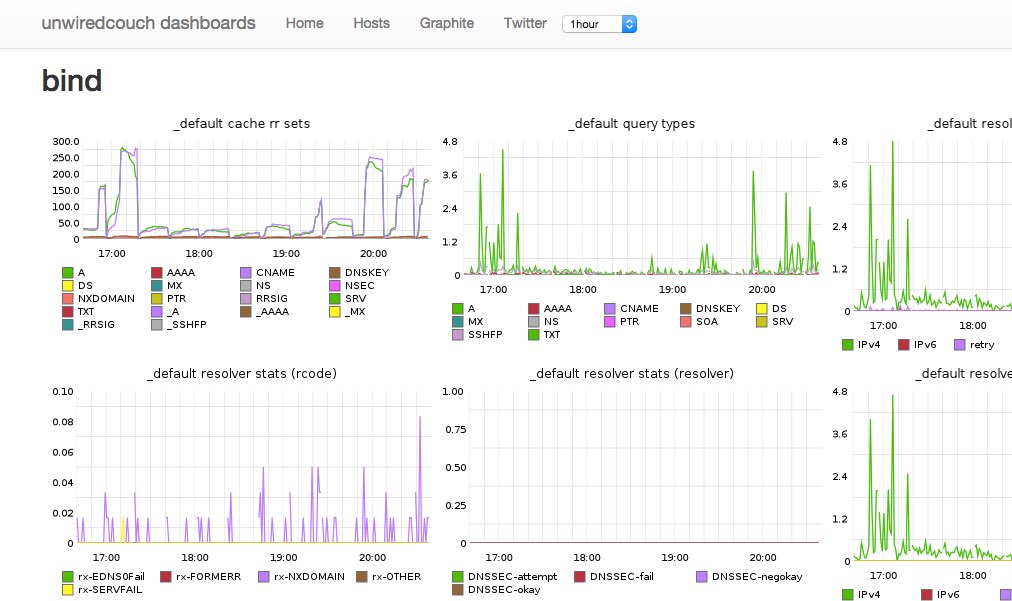
## Look
## Requirements
- PHP >= 5.5
- Graphite
## Installation
- in your dashboards repo, run: `composer require mrtazz/yagd`
- copy `config.example.php` to `config.php` and adapt it
- write php to create your dashboards
## Usage examples
### Generic dashboards
There is a generic `Page.php` class included which can just include all
Graphite graphs you have in an array called `$metrics` like this:
```
renderFullPageWithMetrics($metrics);
```
### Display CollectD host data
If you are using collectd to gather system level graphs you can draw basic
information onto a dashboard like this:
Configure hosts in your `config.php`
```
$CONFIG['hosts'] = [
"foo.example.com" => [
"cpus" => 2,
"filesystems" => [ 'root', 'var', ]
],
"additional_metrics" => [
"disk temp" => [
"disk temperature" => "collectd.foo_example_com.disktemp-ada*.current",
]
],
]
];
```
And then drop something like this into e.g. `htdocs/hosts.php`:
```
getHeader($CONFIG["title"],
$CONFIG["navitems"]);
foreach($CONFIG["hosts"] as $host => $data) {
$fss = empty($data["filesystems"]) ? [] : $data["filesystems"];
$server = new CollectdHost($host, $data["cpus"], $fss,
$data["interfaces"]);
$server->setGraphiteConfiguration($CONFIG["graphite"]["host"]);
echo "
{$host}
";
$server->render();
}
echo $page->getFooter();
```
### Inject a select box into the navbar
For the host page for example you might wanna have an easy way to only show
one host. For that you can inject a select box into the header navbar like
this:
```
";
$selectbox .= " ";
foreach ($CONFIG["hosts"] as $host => $data) {
$selected = ($_GET["hostname"] == $host) ? "selected" : "";
$selectbox .= "{$host}";
}
$selectbox .= "";
$selectbox .= "";
$page = new Page($CONFIG);
echo $page->getHeader($CONFIG["title"],
$CONFIG["navitems"],
$selectbox);
if (empty($_GET["hostname"])) {
$hosts = $CONFIG["hosts"];
} else {
$hosts = [ $_GET["hostname"] => $CONFIG["hosts"][$_GET["hostname"]] ];
}
```
This will show the content of `$selectbox` in the header and only show the
actually selected host (if one was selected) on the page.