https://github.com/msikorski93/vehicle-collisions-in-nyc-in-2018-and-2019
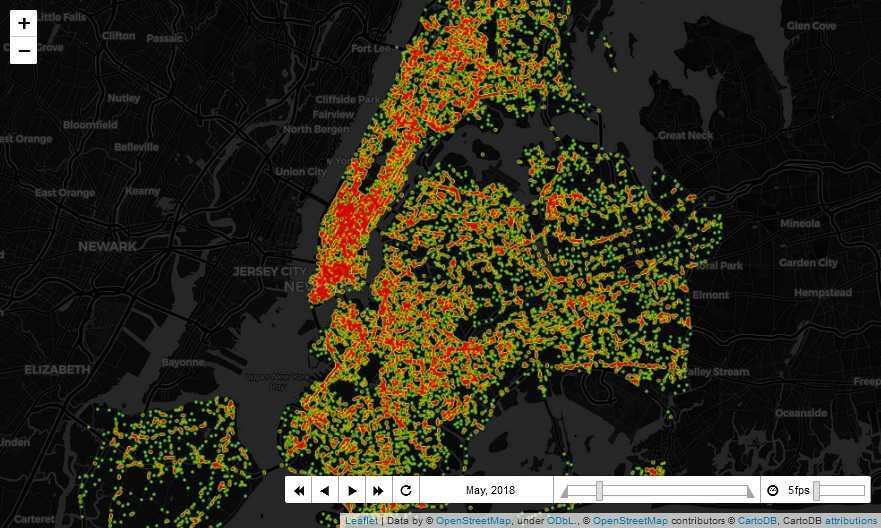
This simple notebook aims to creating Heatmaps with time lapse. Figures were created with folium base maps which allows us to browse them in an interactive manner. The idea is much more to visualize spatial data and create time lapse animations. Results of the project are attached as HTML files.
https://github.com/msikorski93/vehicle-collisions-in-nyc-in-2018-and-2019
Last synced: 4 months ago
JSON representation
This simple notebook aims to creating Heatmaps with time lapse. Figures were created with folium base maps which allows us to browse them in an interactive manner. The idea is much more to visualize spatial data and create time lapse animations. Results of the project are attached as HTML files.
- Host: GitHub
- URL: https://github.com/msikorski93/vehicle-collisions-in-nyc-in-2018-and-2019
- Owner: msikorski93
- Created: 2021-12-25T21:42:29.000Z (almost 4 years ago)
- Default Branch: main
- Last Pushed: 2022-07-27T19:50:50.000Z (over 3 years ago)
- Last Synced: 2025-02-26T15:17:36.854Z (8 months ago)
- Language: Jupyter Notebook
- Size: 7.88 MB
- Stars: 0
- Watchers: 1
- Forks: 0
- Open Issues: 0
-
Metadata Files:
- Readme: README.md
Awesome Lists containing this project
README
# Vehicle-Collisions-in-NYC-in-2018-and-2019
This simple notebook aims to creating Heatmaps with time lapse. Figures were created with folium base maps which allows us to browse them in an interactive manner. The idea is much more to visualize spatial data and create time lapse animations. For interactive visualizations, please use nbviewer link:
https://nbviewer.org/github/msikorski93/Vehicle-Collisions-in-NYC-in-2018-and-2019/blob/main/nyc_collisions_interactive-notebook.ipynb