https://github.com/msoap/t-plot
cli utility for visualising numbers in the terminal
https://github.com/msoap/t-plot
ascii bar-chart chart cli golang terminal visualisation
Last synced: 3 months ago
JSON representation
cli utility for visualising numbers in the terminal
- Host: GitHub
- URL: https://github.com/msoap/t-plot
- Owner: msoap
- License: mit
- Created: 2023-12-25T21:34:57.000Z (over 2 years ago)
- Default Branch: main
- Last Pushed: 2025-10-20T20:21:18.000Z (9 months ago)
- Last Synced: 2025-10-20T22:26:23.894Z (9 months ago)
- Topics: ascii, bar-chart, chart, cli, golang, terminal, visualisation
- Language: Go
- Homepage:
- Size: 27.3 KB
- Stars: 0
- Watchers: 1
- Forks: 0
- Open Issues: 0
-
Metadata Files:
- Readme: README.md
- License: LICENSE
Awesome Lists containing this project
README
[](https://github.com/msoap/t-plot/actions/workflows/go.yml)
# t-plot
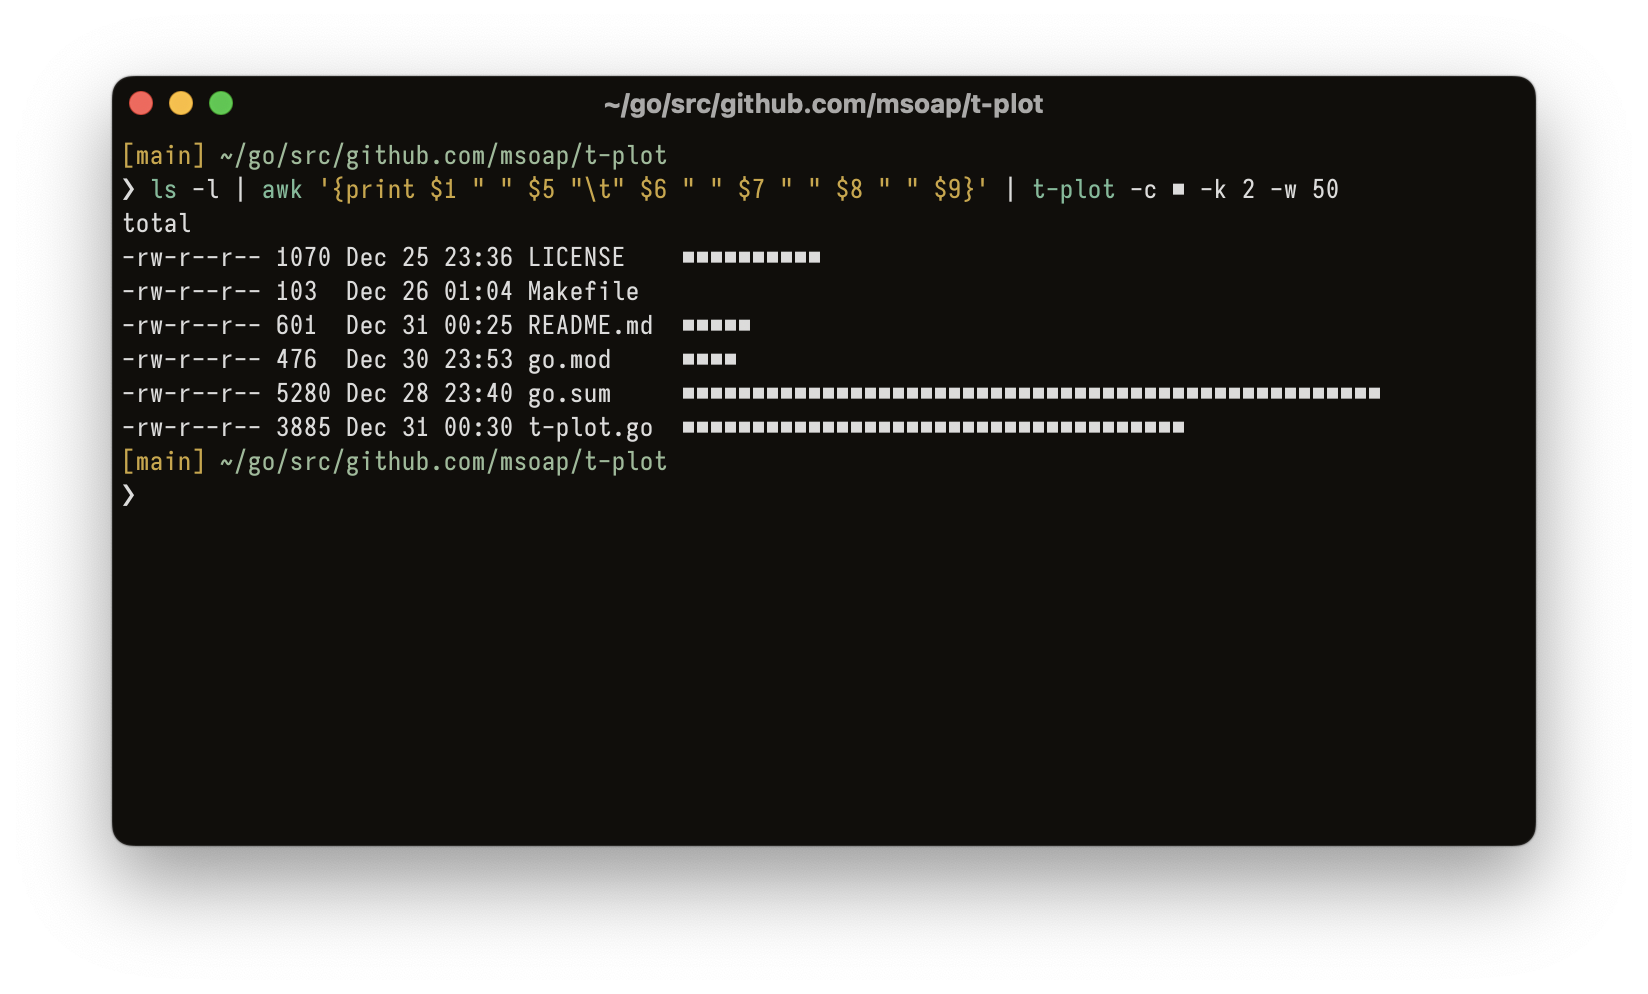
It's simple utility for plot bar chart from numbers in the terminal.
By default it's plot chart from stdin, one number per line and add bar chart to the end of line.
## Installation
```bash
go install github.com/msoap/t-plot@latest
```
## Options
- `-k N` - column number for plot (default: 1)
- `-c "#"` - chart symbol (default: `#`)
- `-w N` - width of chart (default: rest of terminal width)
- `-h` - print help and exit
## Examples
```bash
# plot chart from stdin by file size in ls (column 5)
$ ls -l | t-plot -k 5
# chart by file sizes from du
$ du -s some_path/* | t-plot
```
## Screenshot