https://github.com/mthiboust/colormap2d
Colormap for 2D vectors
https://github.com/mthiboust/colormap2d
colormap data-visualization plotting
Last synced: 10 months ago
JSON representation
Colormap for 2D vectors
- Host: GitHub
- URL: https://github.com/mthiboust/colormap2d
- Owner: mthiboust
- License: apache-2.0
- Created: 2023-10-26T14:54:14.000Z (almost 3 years ago)
- Default Branch: main
- Last Pushed: 2023-11-15T21:43:37.000Z (over 2 years ago)
- Last Synced: 2025-09-30T09:08:48.682Z (10 months ago)
- Topics: colormap, data-visualization, plotting
- Language: Jupyter Notebook
- Homepage:
- Size: 124 KB
- Stars: 1
- Watchers: 1
- Forks: 0
- Open Issues: 0
-
Metadata Files:
- Readme: README.md
- License: LICENSE
Awesome Lists containing this project
README
# 2D Colormap
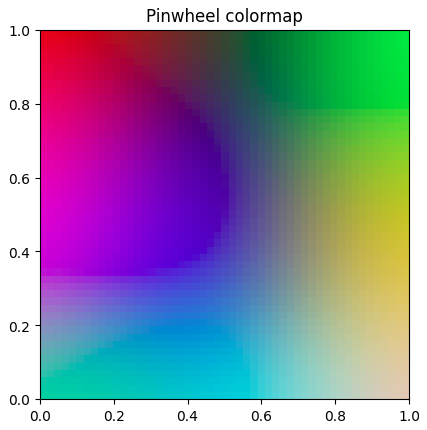
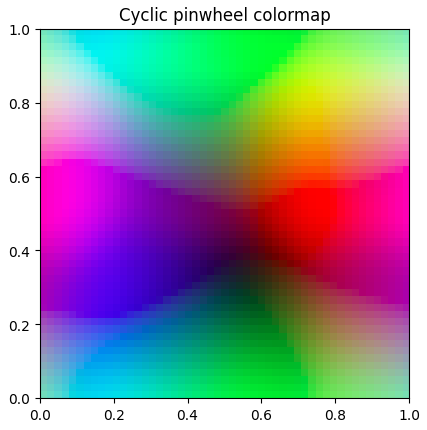
`matplotlib` provides [many colormaps](https://matplotlib.org/stable/users/explain/colors/colormaps.html) that map scalars to colors. However, it does not provide such colormaps for 2D vectors. Representing 2D vectors as colors may be helpful when dealing with complex numbers or 2D coordinates. This library provides 2 colormaps for this purpose including a cyclic one.
## Installation
```shell
pip install colormap2d
```
## Usage
```python
import numpy as np
import colormap2d
some_2d_vectors = np.random.rand(5, 2)
# Random 2D vectors between 0 and 1:
# array([[0.91270668, 0.60020465],
# [0.51569033, 0.79642031],
# [0.36533928, 0.31441287],
# [0.41346207, 0.45163162],
# [0.99135696, 0.05691322]])
colormap2d.pinwheel(some_2d_vectors)
# RGBA float values between 0 and 1 (default)
# array([[0.69019608, 0.6627451 , 0.24705882, 1. ],
# [0.25490196, 0.74509804, 0.82352941, 1. ],
# [0.41960784, 0.2 , 0.79215686, 1. ],
# [0.18823529, 0.29803922, 0.20392157, 1. ],
# [0.24705882, 0.24705882, 0.66666667, 1. ]])
colormap2d.pinwheel(some_2d_vectors, mode="RGB", dtype=np.uint8)
# RGB integers between 0 and 255:
# array([[166, 179, 50],
# [ 50, 66, 94],
# [ 63, 98, 212],
# [ 66, 66, 196],
# [222, 199, 169]], dtype=uint8)
```
## Behind the scene
The colormap data has been created using Self-Organizing Maps.