https://github.com/mwouts/world_trade_data
World Integrated Trade Solution (WITS) API in Python
https://github.com/mwouts/world_trade_data
data statistics trade worldbank
Last synced: about 1 year ago
JSON representation
World Integrated Trade Solution (WITS) API in Python
- Host: GitHub
- URL: https://github.com/mwouts/world_trade_data
- Owner: mwouts
- License: mit
- Created: 2019-11-24T22:42:26.000Z (over 6 years ago)
- Default Branch: master
- Last Pushed: 2023-07-19T14:59:15.000Z (almost 3 years ago)
- Last Synced: 2025-03-10T12:16:27.530Z (over 1 year ago)
- Topics: data, statistics, trade, worldbank
- Language: HTML
- Homepage: https://mwouts.github.io/world_trade_data
- Size: 265 KB
- Stars: 33
- Watchers: 5
- Forks: 12
- Open Issues: 5
-
Metadata Files:
- Readme: README.md
- Changelog: CHANGELOG.md
- License: LICENSE
Awesome Lists containing this project
README
# World Trade Statistics (WITS) API in Python
[](https://travis-ci.com/mwouts/world_trade_data)
[](https://codecov.io/github/mwouts/world_trade_data?branch=master)
[](https://lgtm.com/projects/g/mwouts/world_trade_data/context:python)
[](https://pypi.python.org/pypi/world_trade_data)
[](https://pypi.python.org/pypi/world_trade_data)
[](
https://mybinder.org/v2/gh/mwouts/world_trade_data/master?filepath=README.md)
[](https://mwouts.github.io/world_trade_data)
Star
This package is an implementation of the [World Integrated Trade Solution API](https://wits.worldbank.org/witsapiintro.aspx).
Use this package to explore the [Trade and Tariff Data](https://wits.worldbank.org/) published by the [World Bank](https://www.worldbank.org/).
This python package itself is licenced under the MIT License. Different Terms and Conditions apply to the WITS data itself, please read the [Frequently Asked Questions](https://wits.worldbank.org/faqs.html) on the WITS website.
# Quick tutorial
## Installation
Install or update the _World Trade Data_ python package with
```
pip install world_trade_data --upgrade
```
## Get the list of countries, products, indicators
See the outputs of the commands below on [GitHub](https://mwouts.github.io/world_trade_data/). Or even, open this `README.md` as a notebook and run it interactively on [Binder](https://mybinder.org/v2/gh/mwouts/world_trade_data/master?filepath=README.md)!
```python
import pandas as pd
import world_trade_data as wits
pd.set_option('display.max_rows', 6)
```
```python
wits.get_countries()
```
```python
wits.get_products()
```
```python
wits.get_indicators()
```
All these methods accept a `datasource` argument, which can be any of
```python
wits.DATASOURCES
```
The nomenclature, and data availability, are accessible with `get_nomenclatures()` and `get_dataavailability()`.
## Get the Trade or Tariff data
Indicators are available with `get_indicator`. Tariff rates can be loaded with `get_tariff_reported` and `get_tariff_estimated`.
## Working with codes rather than with category names
The three functions above accept a `name_or_id` argument that defaults to `'name'`. Use `name_or_id='id'` to
get codes rather than full description for products and countries:
```python
wits.get_indicator('MPRT-TRD-VL', reporter='usa', year='2017', name_or_id='id')
```
## Sample use case
In the below we show how to collect and plot the Import and Export data for the USA in 2017.
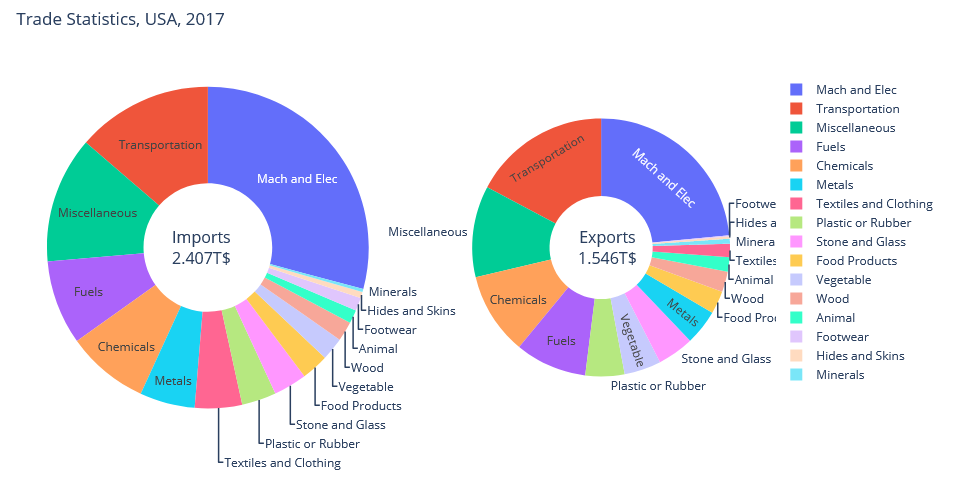
To begin with, we request the values for the corresponding import and exports. Here, we use the default value for `partner='wld'`, and the default value for `product='all'`.
```python
usa_imports_2017 = wits.get_indicator('MPRT-TRD-VL', reporter='usa', year='2017')
usa_exports_2017 = wits.get_indicator('XPRT-TRD-VL', reporter='usa', year='2017')
```
```python
usa_imports_2017
```
Now we remove the first levels of the index
```python
usa_imports_2017 = usa_imports_2017.loc['Annual'].loc['United States'].loc['World']
usa_exports_2017 = usa_exports_2017.loc['Annual'].loc['United States'].loc['World']
```
Note that one line in the table gives the value for imports on all products:
```python
usa_imports_2017.loc['All Products']
```
In order to avoid double counting, we only look at sectors:
```python
products = wits.get_products()
sectors = products.loc[(products.grouptype=='Sector') & (products.index!='Total')].productdescription.values
sectors
```
and make sure that we reproduce well the total:
```python
assert pd.np.isclose(usa_imports_2017.loc[sectors].Value.sum(), usa_imports_2017.loc['All Products'].Value)
```
Finally we represent the data using e.g. [Plotly's Pie Charts](https://plot.ly/python/pie-charts/)
```python
import plotly.graph_objects as go
from plotly.subplots import make_subplots
imports_musd = usa_imports_2017.loc[sectors].Value / 1e3
exports_musd = usa_exports_2017.loc[sectors].Value / 1e3
fig = make_subplots(rows=1, cols=2, specs=[[{'type':'domain'}, {'type':'domain'}]])
fig.add_trace(go.Pie(labels=sectors, values=imports_musd, name="Imports"), 1, 1)
fig.add_trace(go.Pie(labels=sectors, values=exports_musd, name="Exports"), 1, 2)
fig.update_traces(hole=.4,
scalegroup='usa',
textinfo='label',
hovertemplate = "%{label}
%{value:,.0f}M$
%{percent}")
fig.update_layout(
title_text="Trade Statistics, USA, 2017",
annotations=[dict(text='Imports
{:.3f}T$'.format(imports_musd.sum()/1e6),
x=0.17, y=0.5, font_size=16, showarrow=False),
dict(text='Exports
{:.3f}T$'.format(exports_musd.sum()/1e6),
x=0.83, y=0.5, font_size=16, showarrow=False)])
fig.show(renderer='notebook_connected')
```
# References & Alternatives
- The official [WITS portal](https://wits.worldbank.org/) let you visualize and download trade and tariff data. And the API implemented in this package is documented [here](https://wits.worldbank.org/witsapiintro.aspx).
- The WITS data can be accessed in R with the [tradestatistics](https://tradestatistics.io/) library.
- An alternative way to access the WITS data is to use [pandasdmx](https://pandasdmx.readthedocs.io/).