https://github.com/ncsoft/timesuperin
R library for time series data modeling
https://github.com/ncsoft/timesuperin
Last synced: 10 months ago
JSON representation
R library for time series data modeling
- Host: GitHub
- URL: https://github.com/ncsoft/timesuperin
- Owner: ncsoft
- License: other
- Created: 2018-07-19T08:17:30.000Z (almost 8 years ago)
- Default Branch: master
- Last Pushed: 2018-12-06T06:22:03.000Z (over 7 years ago)
- Last Synced: 2025-03-02T07:49:29.770Z (over 1 year ago)
- Language: R
- Size: 43.9 KB
- Stars: 2
- Watchers: 2
- Forks: 2
- Open Issues: 0
-
Metadata Files:
- Readme: README-ENGLISH.md
- License: LICENSE
Awesome Lists containing this project
README
# Timesuperin
Timesuperin is R library for analyzing time-series data and detecting anomalies in them. The name Timesuperin is the abbreviation of “Time Superintendent”. The package generates a proper regression model based on time-series specificity and unique events in your data, and detect anomalies by checking any significant difference between estimated values and real ones.
# Installation
To use the package, following libraries should be installed:
* Rcpp
* rstan
* BH
* stringi
When these libraries are installed, execute following code.
```{r}
devtools::install_github("ncsoft/timesuperin")
```
If R version higher than 3.5.0 is used, devtools may break installation. In this case, following code would be helpful.
```{r}
library(devtools)
find_rtools() # If error is printed messaging R 3.5.0 compatibility, run following code
assignInNamespace("version_info",
c(devtools:::version_info,
list("3.5" = list(version_min = "3.3.0", version_max = "99.99.99", path = "bin"))), "devtools")
```
## Mini example
In this example, we use a sample data in the package. Load train and test data in `timesuperin/resources`.
```{r}
train_data <- read.csv('./train_data.csv')
test_data <- read.csv('./test_data.csv')
```
Two datasets are time-series data affected by two event variables. Let's plot training data.
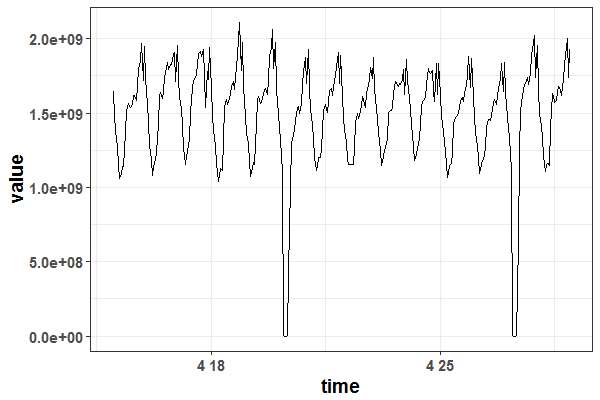
Now we generate baseline time-series model as follows:
```{r}
model <- model.timesuperin(train_data, model.type = 'lm', period = 6)
```
Based on the model generated, we try to detect anomalies in test data.
```{r}
anomaly.detect <- detect_anomal.timesuperin(model, test_data, value = test_data$value)
```
The result of anomaly detection is also provided by interval plot.
```{r}
anomaly.detect$Interval_Plot
```
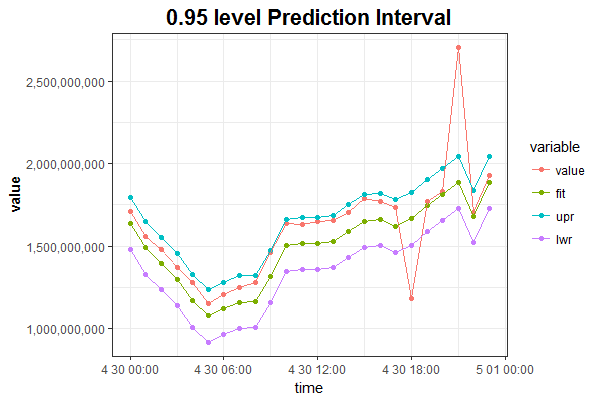
Two points in data are out of bounds according to upr and lwr, which may be labelled as anomaly.