https://github.com/netscaler/microapp-application-troubleshooting
Microapp Troubleshooting Documentation
https://github.com/netscaler/microapp-application-troubleshooting
Last synced: 16 days ago
JSON representation
Microapp Troubleshooting Documentation
- Host: GitHub
- URL: https://github.com/netscaler/microapp-application-troubleshooting
- Owner: netscaler
- Created: 2020-08-13T16:41:46.000Z (over 5 years ago)
- Default Branch: master
- Last Pushed: 2020-08-31T19:12:09.000Z (over 5 years ago)
- Last Synced: 2025-06-08T23:35:27.579Z (8 months ago)
- Size: 1.91 MB
- Stars: 0
- Watchers: 2
- Forks: 1
- Open Issues: 0
-
Metadata Files:
- Readme: README.md
Awesome Lists containing this project
README
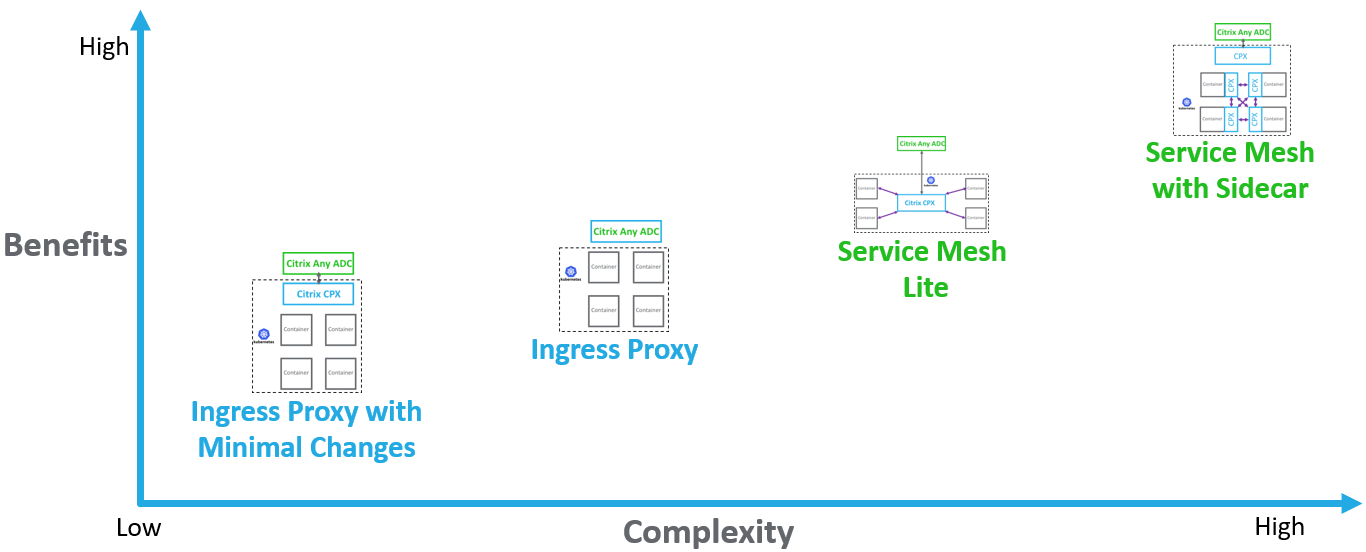
# Citrix Architecture Choices for Kubernetes Environments
Architecture flexibility, so you can move to Cloud Native at your own pace.
Prometheus Embedded Grafana:
* [Grafana](http://grafana.org/) supports querying Prometheus. The Grafana data source for Prometheus is included since Grafana.
* By Default, Grafana will be listening on "http://localhost:3000". The default login is "admin" / "admin".
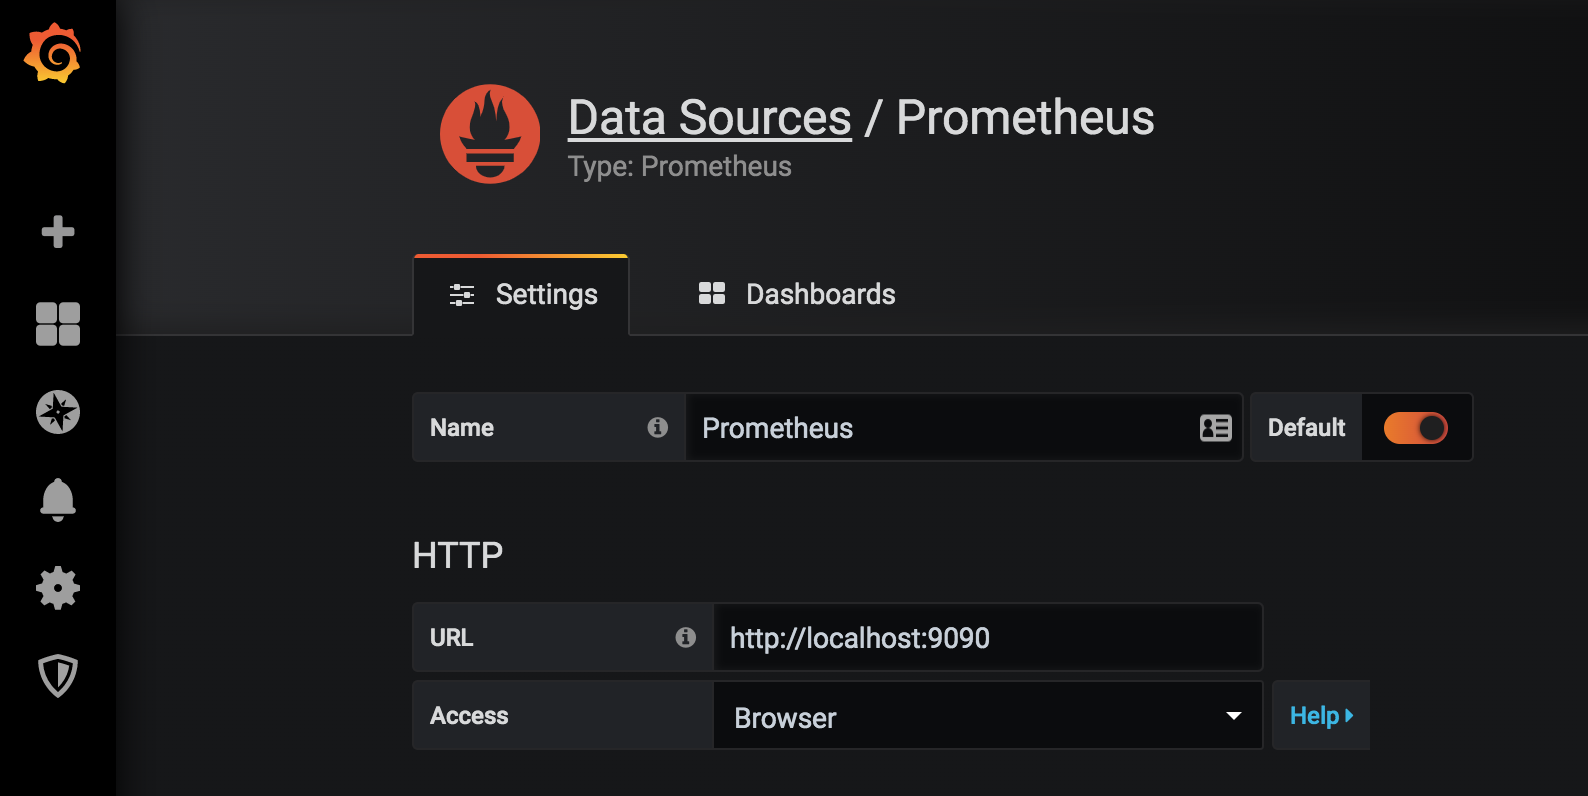

* For more information on Grafana support for Prometheus see [this](https://prometheus.io/docs/visualization/grafana/).
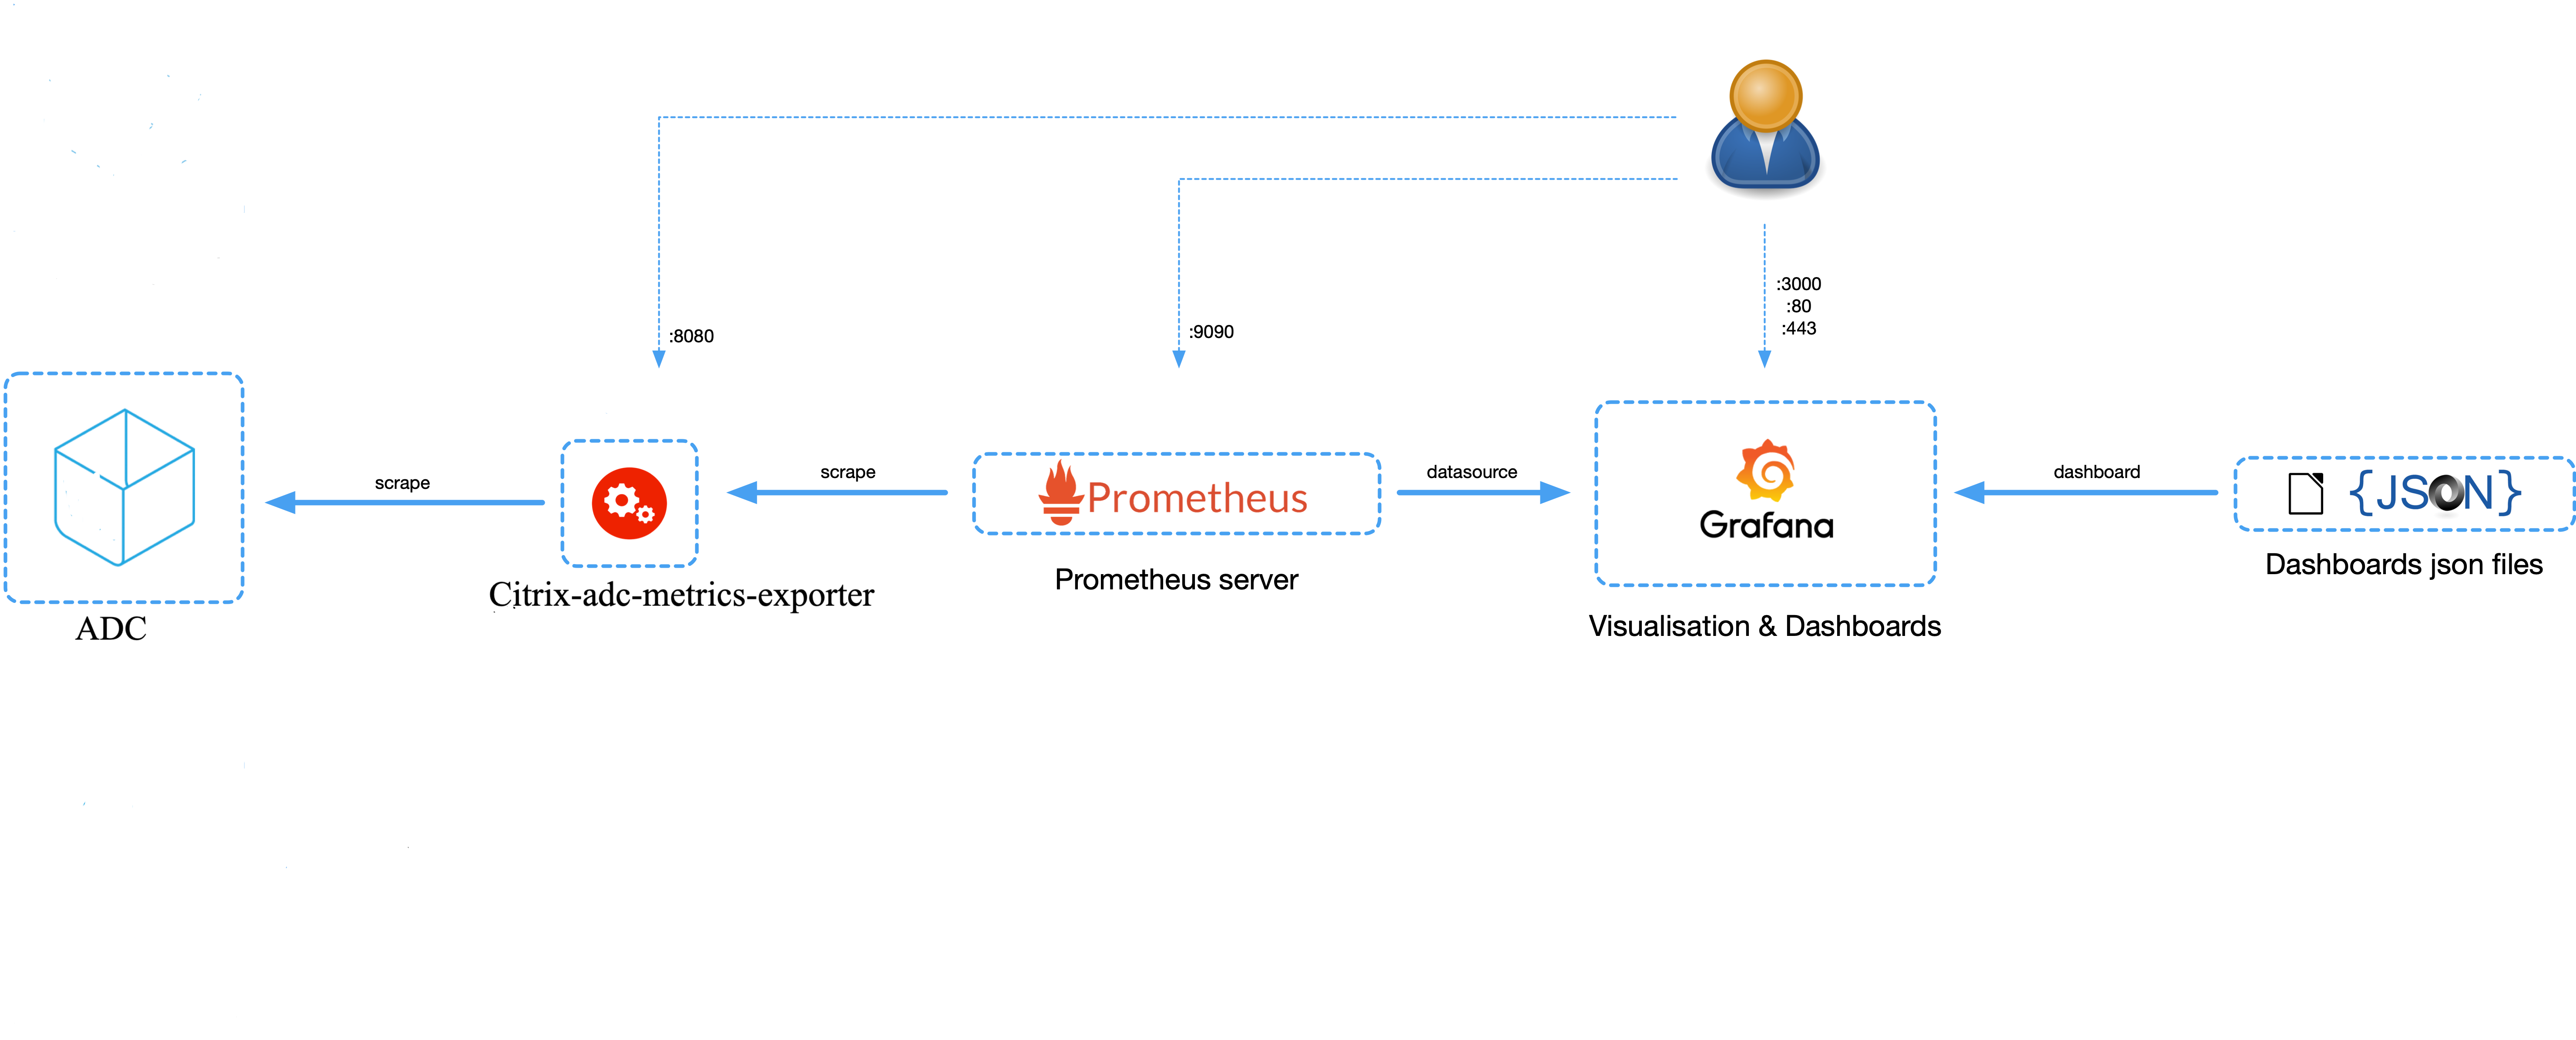
## Exporter for Citrix ADC
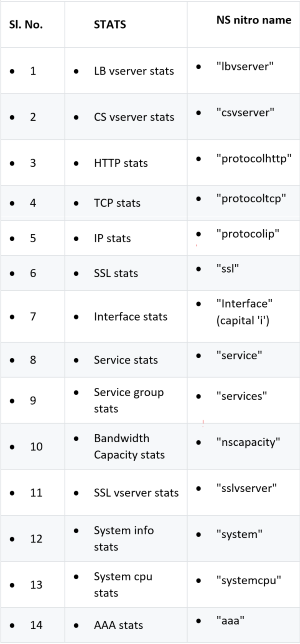
* The exporter is configured to export some of the most commonly used stats for a Citrix ADC device. They are mentioned in the metrics.json file and summarized in the table below.
For more information on the Exporter for Citrix ADC see [this](https://github.com/citrix/citrix-adc-metrics-exporter).
Kibana Visualization Overview – ELK Stack Tool Set
Elk Stack – Opensource Combination Overview, view trends of errors or significant events.
1. ElasticSearch (port:9200 Database and Index) – Apache Lucene based search engine developed using Java.
1. Logstash (Data Pipeline to Elasticsearch Repository) – Tool for collecting and monitoring logs from remote machines.
* receives data from Syslogs, Log Files, Kafka Ques, Rabbit MQ, etc…
1. Kibana (Webport:5601 UI front end for the ELK stack) – Data Exploration and Visualization Tool for mining ElasticSearch.
* enables searching and interact data
* allows performing advanced analytics and reports
* enables creation and sharing data dashboards in real-time
1. Splunk – Not Opensource allows for the same visualization of logs streams.
1. Datadog – Cloud based, uses API library.
For a video Tutorial of Kibana, please see [this](https://www.youtube.com/watch?v=gQ1c1uILyKI).
Using Kibana to view data:
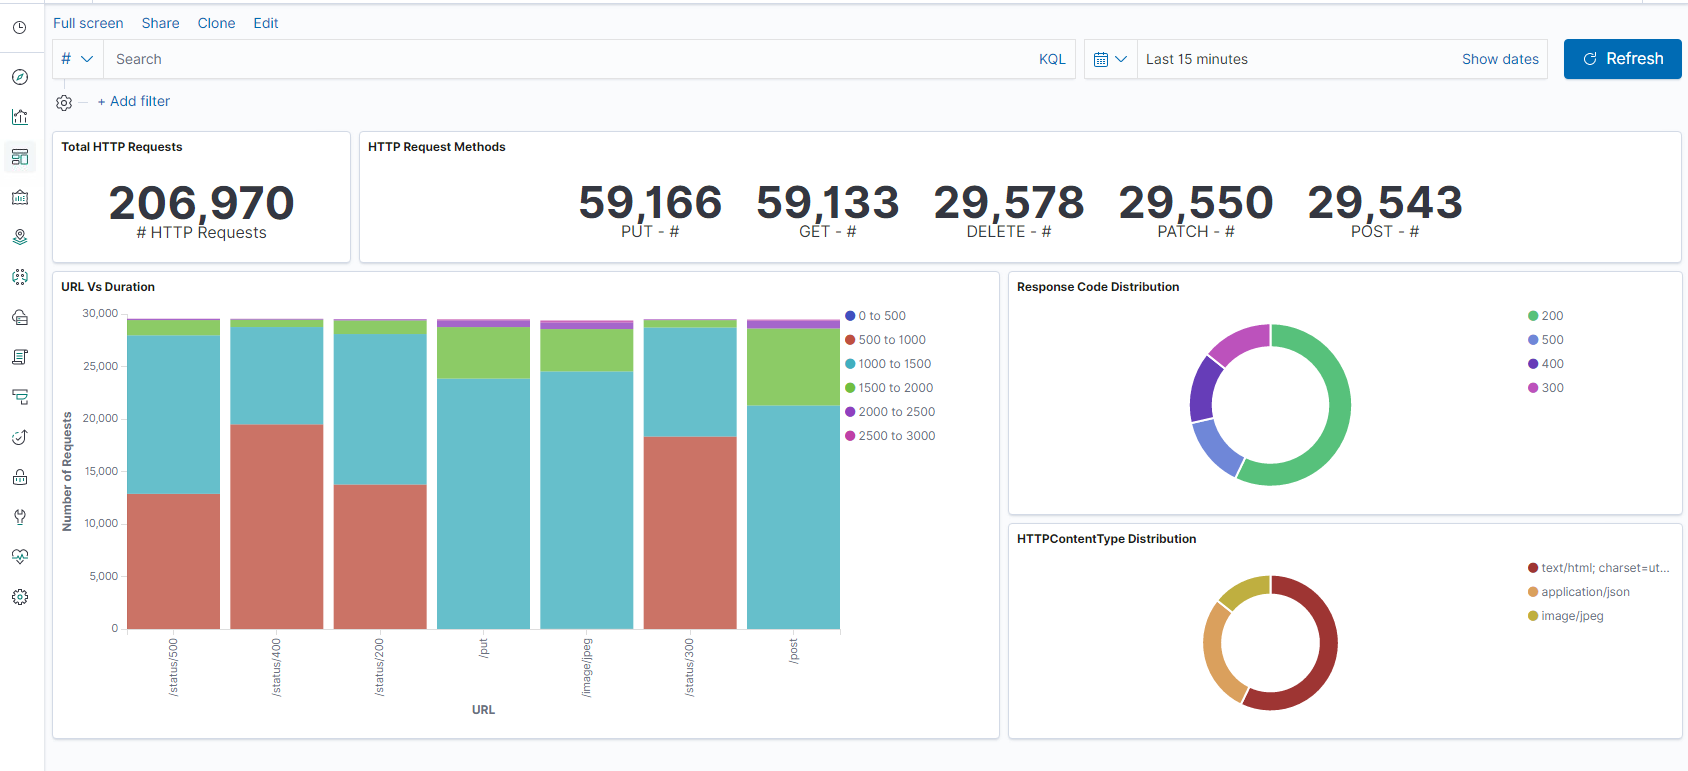
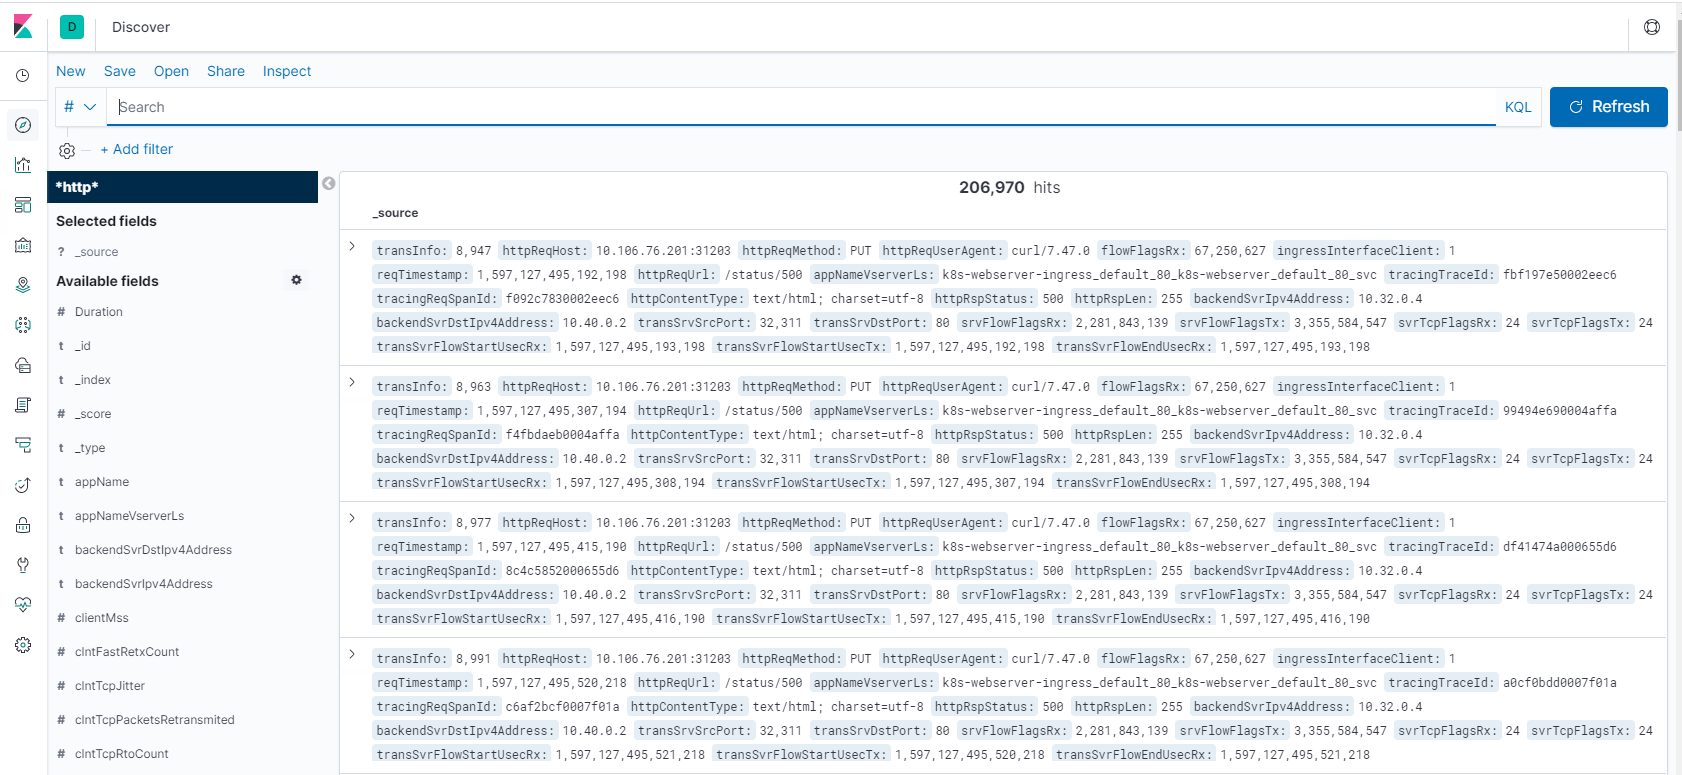
* Step 1: Configure Index Pattern for Logstash
* Step 2: Select the index and generate traffic to populate.
* Step 3: generate application from the un-structured data from log feeds.
* Step 4: Kibana will format the logstash inputs to create reports and dashboards.
* Time Range
* Tabular View
* Hit counts based on the application.
* Time IP, Agent, Machine.os, Response Code (200), URL
* Filter on values
* Step 5: Visualize the data in a report of aggregations.
* Result aggregation in a chart report (pie, graph, etc.)
## Citrix Observability Exporter
Citrix Observability Exporter collects timeseries and transactional data from multiple Citrix ADCs and transforms them to consumable opensource formats. The transformed data can be consumed by analytical infrastructure hosted on cloud or on-prem. The analytical infrastructure can use the COE data to get valuable insights and troubleshoot applications proxied by Citrix ADCs.
For more info on COE, see [this](https://github.com/citrix/citrix-observability-exporter).
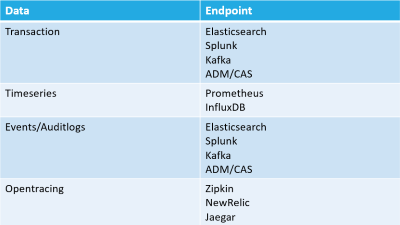
COE supported event-based endpoint feeds (logs):
* [Zipkin](https://zipkin.io/) – COE instrumented Distributed Tracer (requires Elasticsearch)
* Allows a way to capture data points specific to each microservice which is handling a request and analyze them to get meaningful insights.
* [Kafka](https://kafka.apache.org/) - Apache Software Foundation, written in Scala and Java
* Distributed Streaming via HTTTP Headers.
* Provides a unified, high-throughput, low-latency platform for handling real-time data feeds (called topics).
* Citrix Observability Exporter converts the transaction data to Avro format and streams them to Kafka.
* [Elasticsearch](https://www.elastic.co/products/elasticsearch) - ElasticSearch (port:9200 Database and Index) – Apache Lucene based search engine developed using Java
* [Prometheus](https://prometheus.io/docs/introduction/overview/) – Embedded logging feed for Grafana
For more information on the Citrix Observability Exporter, see [this](https://github.com/citrix/citrix-observability-exporter).
Architecture:

Performance & Limitations:
COE Performance
* COE can push 50K HTTP RPS if the data format is Avro.
* COE can push 10K HTTP RPS if the data format is Json.
COE Limitations
* Transactional data format should be set at beginning and cannot be modified live. When the ‘processormode’ is set to ‘Json’, COE can export data to ES & Tracing. When ‘processormode’ is set to ‘Avro’, COE can export data to Kafka & Tracing. This setting is done only once in the beginning and cannot be changed at runtime.
* COE cannot push data to multiple endpoints with different processormodes – example: COE cannot push data to ES and Kafka in parallel.
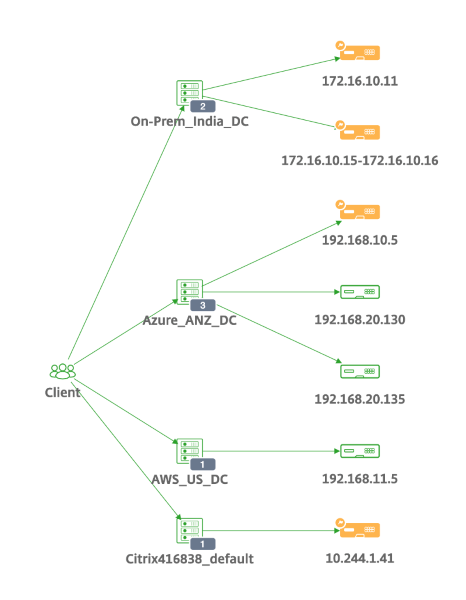
Citrix Service Graph Applications:
Global Service Graph:
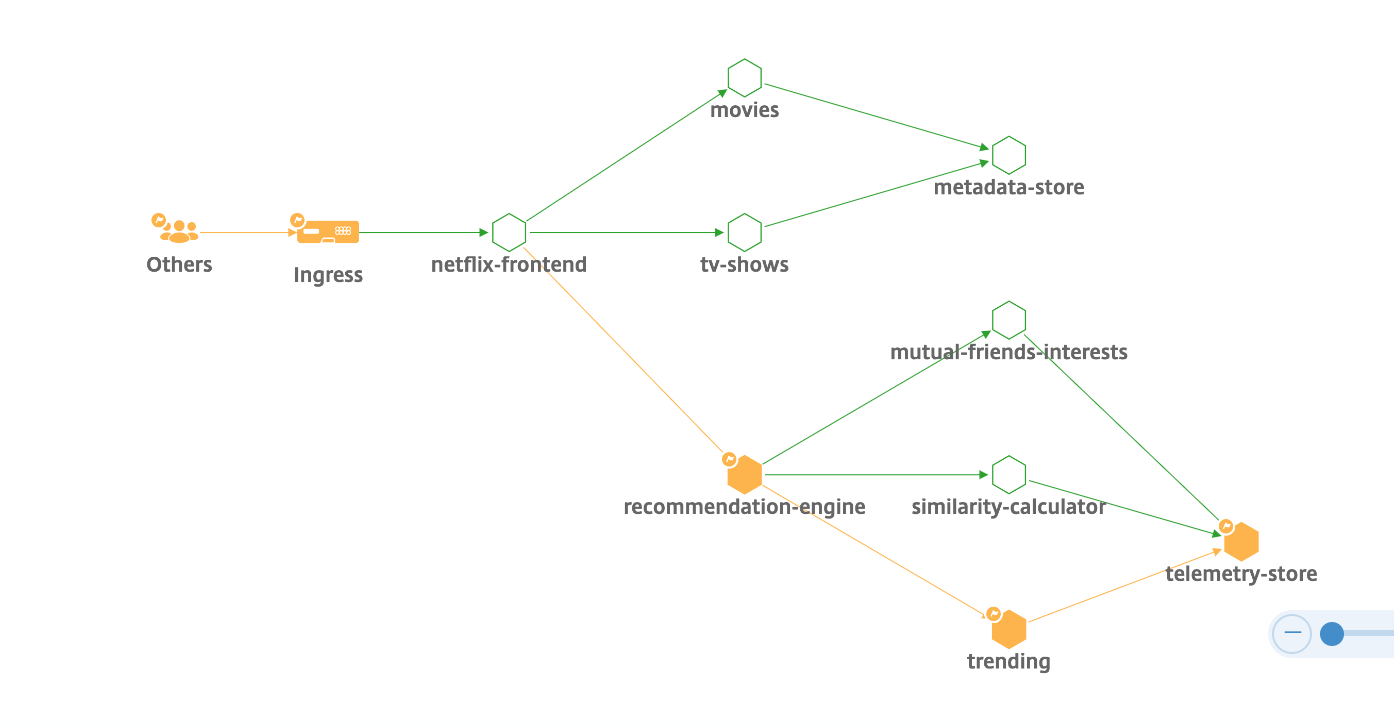
MicroService Graph:
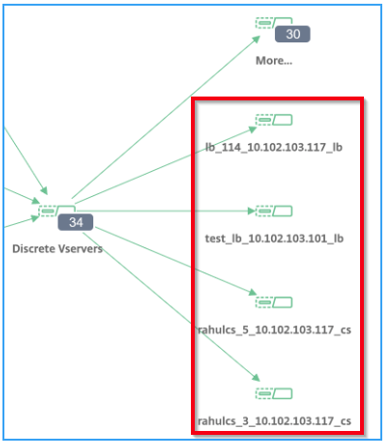
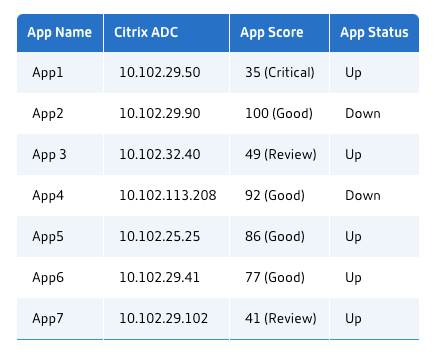
View discrete applications, this service graph displays the top 4 low scored discrete applications.
* Ensure end-to-end application overall performance
* Identify bottlenecks created by inter-dependency of different components of your applications
* Gather insights into the dependencies of different components of your applications.
* Monitor services within the Kubernetes cluster.
* Monitor which service has issues.
* Check the factors contributing to performance issues.
* View detailed visibility of service HTTP transactions.
* Analyze the HTTP, TCP, and SSL metrics.
## Service – Summary Metrics in Service Graph
### HTTP Metrics
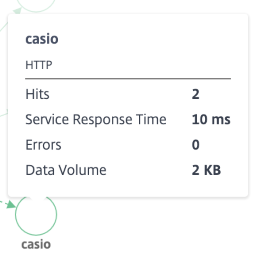
* Hits – Indicates the total number of hits received by the service.
* Service Response Time – Indicates the average response time taken from the service to respond for Time To First Byte (TTFB).
* Errors – Indicates the total errors such as 4xx, 5xx, and so on.
* Data volume – Indicates the total volume of data processed by the service.
### SSL Metrics
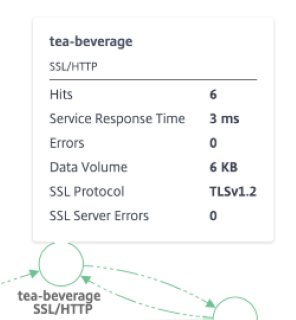
* **SSL Server Errors** – Indicates the total SSL errors from the server. (ex: SSL certificate unknown)
* **SSL Protocol** – Indicates the SSL protocol version used by the service.
* **SSL Client Errors** - Indicate the total SSL errors from the client. (ex: Handshake Failure)
* **SSL Server Errors** - The total SSL backend errors from the service. (ex: Client Auth Failure)
### TCP Metrics
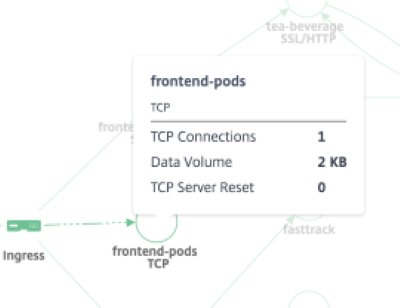
* TCP connections – Total connections established between the services.
* Data Volume – Total data processed by the service.
* TCP Server / Client Reset – Total TCP resets initiated from the server/ client.
Service Graph Summary:
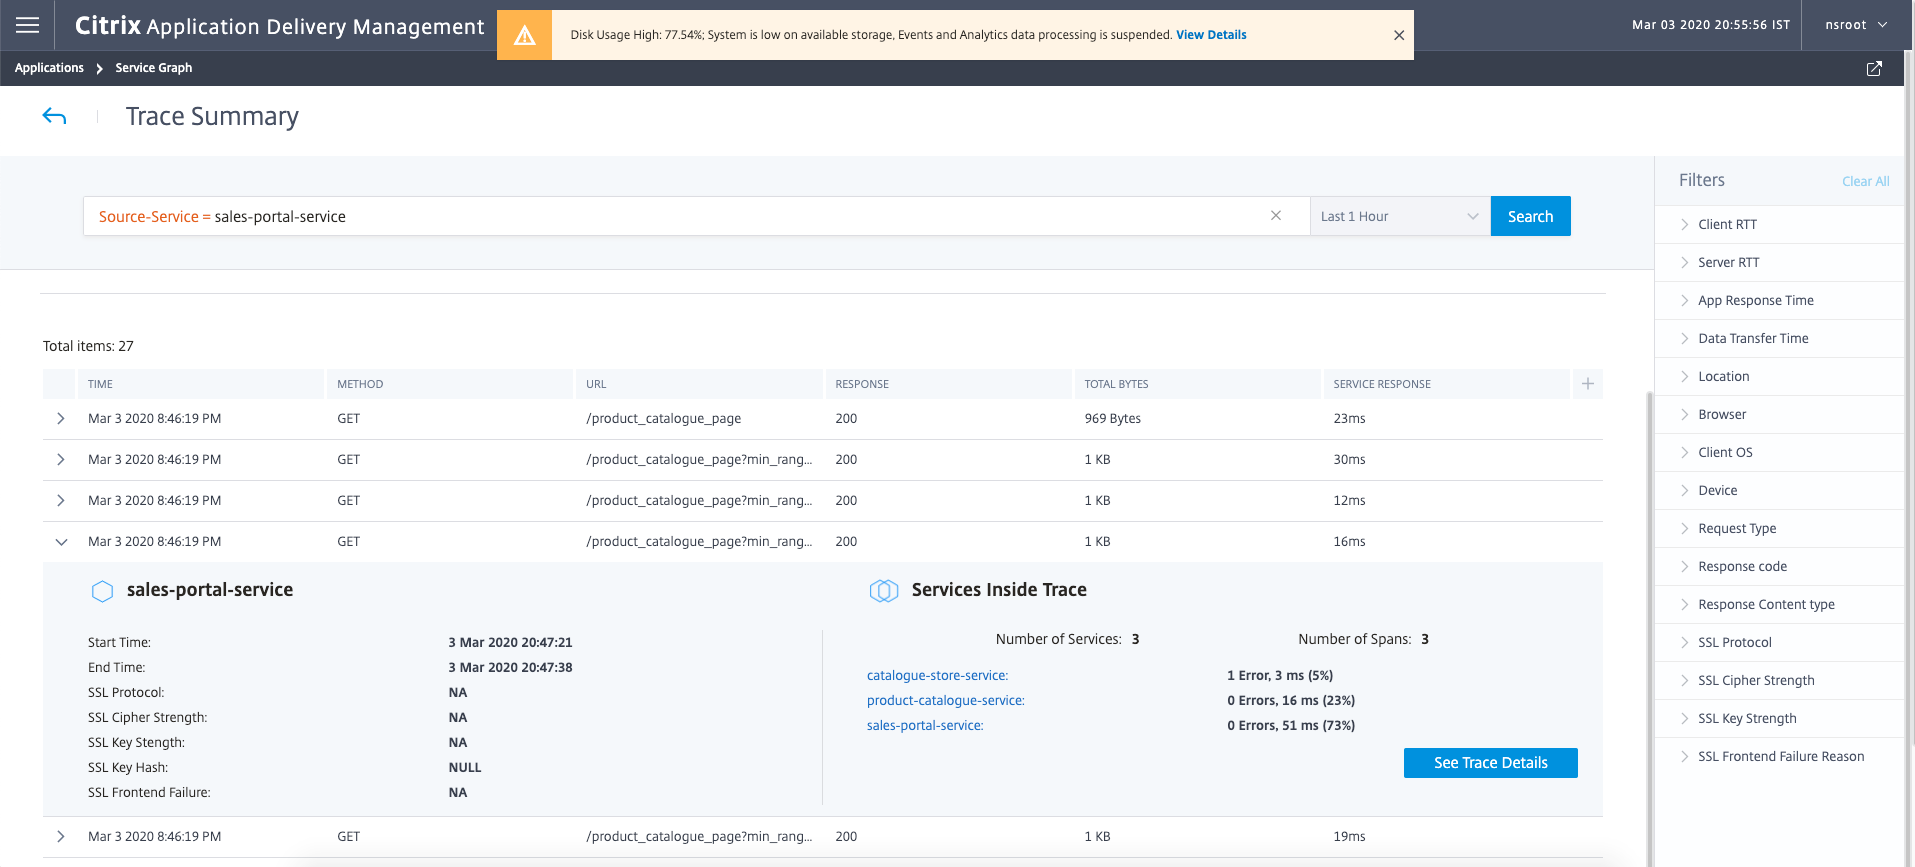
Service Graph Distributed Tracing:
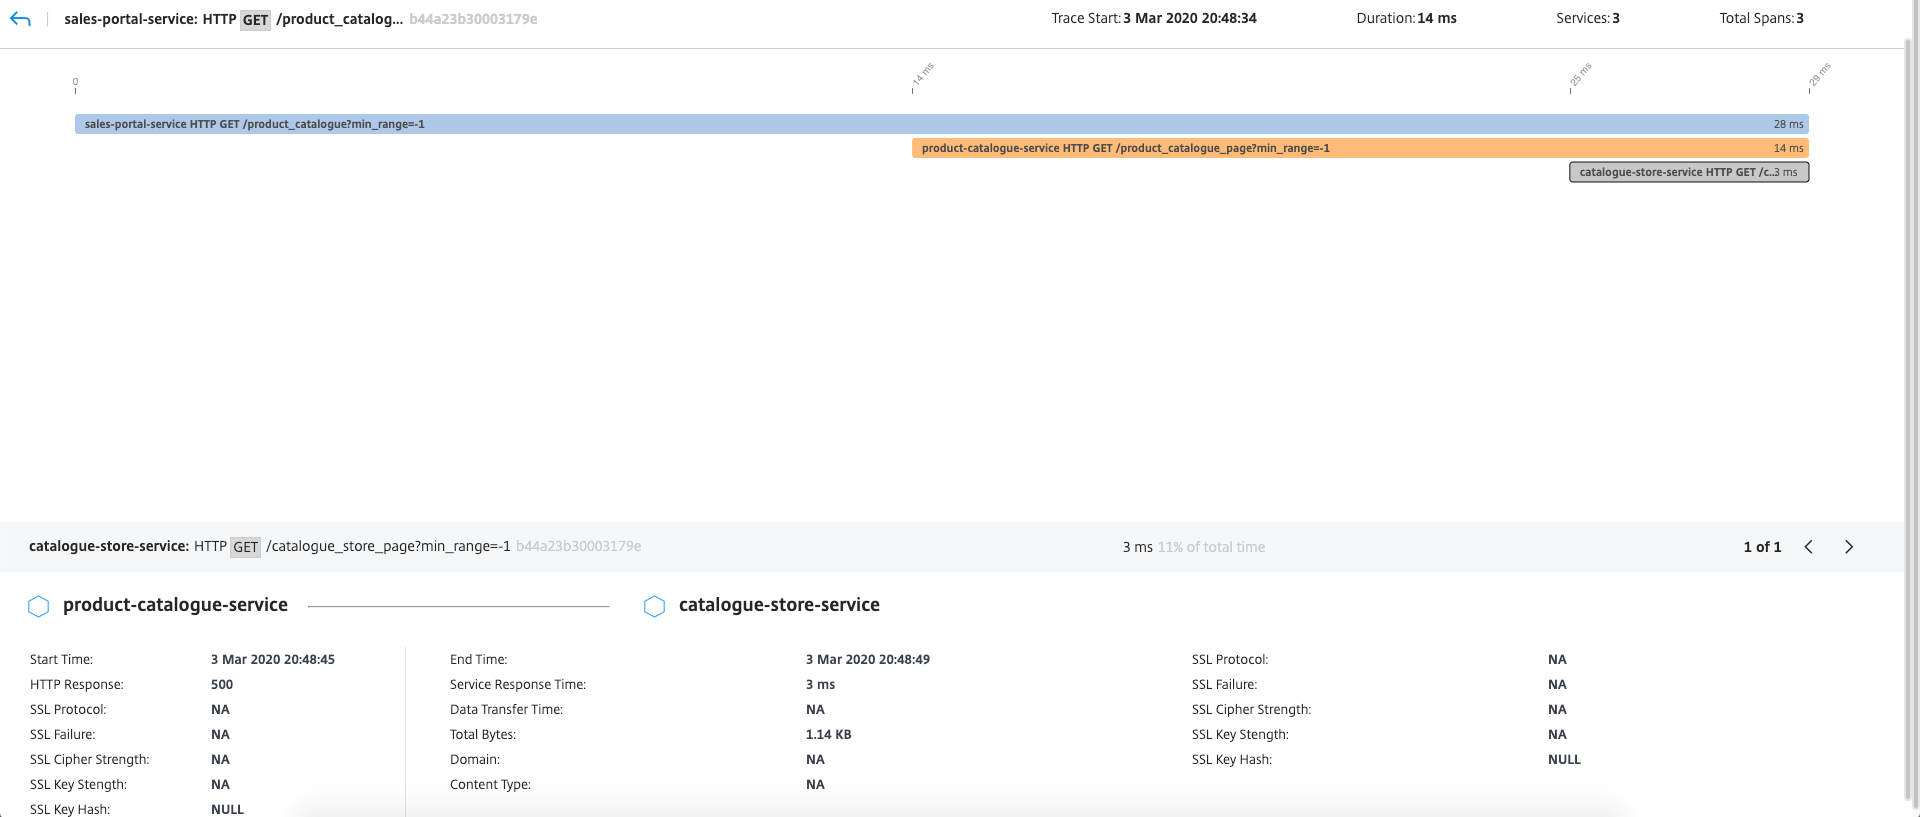
Service Details:


## NSTRACE Commands
Packet Captures
By default, the ADC uses the nstrace script and outputs to /var/nstrace – either **CAP** or **PCAP** file formats **(use ‘-traceformat’ to specify from CLI)**. These can be run from the GUI or CLI.
* Use ‘-size 0’ to capture all packets (specify in zero in ‘Packet Size’ field in GUI)
* Let the ADC decrypt all encrypted traffic in the trace with the ‘-sslplain’ argument.
* This is available in the GUI, but you must expand the More section.
* *BE AWARE* of what you are doing, when saving unencrypted traffic!
* This option eliminates the need to import private keys into wireshark.
* Note: wireshark cannot decrypt ECC!
* Start a trace (CLI): start nstrace -size 0 -mode sslplain
* Stop a trace (CLI): stop nstrace
* Show the status of the trace: show nstrace
* Capture filter for a specific vServer: -filter “vsvrname == ”
* Capture filter for a destination IP: -filter “DESTIP == ”
* Other filters:
* SOURCEIP
* DESTIP
* DESTPORT
* CONNECTION.INTF.EQ(0/1)*
* CONNECTION.VLANID.EQ(3)*
* *Interface\VLAN captures require the ‘-tcpdump ENABLED’ argument
* Cyclical Traces can help troubleshoot intermittent issues by allowing you to define the length of time for each trace file and how many files before overwriting.
* Example: Start a new trace every 30 seconds and create no more than 50 files before starting to overwrite the files.
* >start nstrace -size 0 -mode sslplain -filter “CONNECTION.DSTIP.EQ(10.1.1.13) || CONNECTION.SRCIP.EQ(192.168.1.118)” -nf 50 -time 30
### CPX NSTRACE Commands – Shows Underlay
root@cpx-ingress1-678bd844c7-bmnp5:/cpx/nstrace# cli_script.sh ‘start nstrace -mode RX NEW_RX TX TXB -size 0’
exec: start nstrace -mode RX NEW_RX TX TXB -size 0
Done
root@cpx-ingress1-678bd844c7-bmnp5:/cpx/nstrace# cli_script.sh 'stop nstrace'
exec: stop nstrace
Done
root@cpx-ingress1-678bd844c7-bmnp5:/cpx/nstrace# ls
28Jul2020_16_01_18
root@cpx-ingress1-678bd844c7-bmnp5:/cpx/nstrace# cd 28Jul2020_16_01_18
root@cpx-ingress1-678bd844c7-bmnp5:/cpx/nstrace/28Jul2020_16_01_18# ls
nstrace1.cap
root@cpx-ingress1-678bd844c7-bmnp5:/cpx/nstrace/28Jul2020_16_01_18#

CPX NSTRACE Steps
* **Step 1**
kubectl exec -it cpx-ingress1-678bd844c7-bmnp5 ssh root@127.0.0.1
Password linux
Shell#
* **Step 2**
cli_script.sh ‘start nstrace -mode RX NEW_RX_TX TXB -size 0’
* **Step 3**
cli_script.sh ‘stop nstrace’
* **Step 4**
Exit cpx shell
kubectl cp cpx-ingress1-678bd844c7-bmnp5:/cpx/nstrace/28Jul2020_15_04_58/nstrace1.cap/tracefiles/
* **Step 5 (On Master Node)**
scp root@10.10.0.132:/cpx/nstrace/28Jul2020_15_04_58/nstrace1.cap.
The authenticity of host '10.10.0.132 (10.10.0.132)' can't be established.
ECDSA key fingerprint is SHA256:l8jGMLeRAhUJMLaQReHLmb7SFizuFaj4RwEP23XQmbs.
Are you sure you want to continue connecting (yes/no)? yes
Warning: Permanently added '10.10.0.132' (ECDSA) to the list of known hosts.
nstrace1.cap
root@10.10.0.132's password:
nstrace1.cap
100% 384KB 384.0 KB/s 00:00
* **Step 6**
Scp to workstation and open in Wireshark
For more information on configuring the Citrix ADC CPX, see [this](https://docs.citrix.com/en-us/citrix-adc-cpx/13/configure-cpx.html).
### CPX NSTCPDUMP Commands – Shows Overlay
Nstcpdump:
Nstcpdump can be used for more low-level troubleshooting. Nstcpdump does not collect as much detailed information as nstrace. Open NetScale CLI and shell. You can use filters with nstcdump, but cannot use filters specific to NetScaler resources. The dump output can be viewed directly within the CLI screen.
* nstcpdump.sh dst host x.x.x.x – Shows traffic sent to the destination host.
* nstcpdump.sh -n src host x.x.x.x – Shows traffic from specified host and don’t convert IP addresses to names (-n).
* nstcpdump.sh host x.x.x.x – Shows traffic to and from specified host IP.
* nstcpdump.sh -c 10 dst host 192.168.0.242 – Outputs the first 10 packets from destination 192.168.0.242.
Example:
> root@cpx-ingress1-678bd844c7-bmnp5:/cpx/nstrace# nstcpdump.sh -n src 10.10.0.132
