https://github.com/nim444/featherbar
https://github.com/nim444/featherbar
Last synced: about 1 month ago
JSON representation
- Host: GitHub
- URL: https://github.com/nim444/featherbar
- Owner: nim444
- License: apache-2.0
- Created: 2026-06-06T17:27:05.000Z (about 1 month ago)
- Default Branch: main
- Last Pushed: 2026-06-06T17:59:26.000Z (about 1 month ago)
- Last Synced: 2026-06-06T18:08:06.257Z (about 1 month ago)
- Language: Rust
- Size: 0 Bytes
- Stars: 0
- Watchers: 0
- Forks: 0
- Open Issues: 0
-
Metadata Files:
- Readme: README.md
- License: LICENSE
Awesome Lists containing this project
- awesome-rust-tools - featherbar - bar system monitor showing CPU, RAM, power, and temperature. (System Monitor)
README


[](https://crates.io/crates/featherbar)
[](https://crates.io/crates/featherbar)
[](LICENSE)
____
# featherbar
**A featherweight macOS menu-bar system monitor that stays featherweight.**
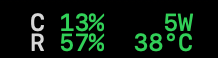
A tiny, modular menu-bar (NSStatusItem) app in Rust that shows live stats on two compact, color-coded lines:
Updates every 2 seconds. Right-click for launch-at-login and Quit. That's the whole app — and that's the point.
> **The premise.** Most menu-bar monitors slowly become what they measure: background threads, growing buffers, tens of MB of RSS. featherbar runs **zero background threads** and allocates **nothing that accumulates** — one main-thread event loop wakes on a timer, takes one sample, redraws the display, and re-arms. Memory stays flat for as long as it runs.
## Features
- **Live stats on two stacked lines**: CPU % + battery watts on top, RAM % + CPU temperature below, refreshed every 2s
- **Color-coded severity**: each value renders green / orange / red by its own thresholds (CPU 40/70%, RAM 60/80%, power 10/20W, temp 60/80°C); labels stay neutral
- **Perfectly gridded**: SF Mono with fixed-width value fields — nothing shifts when a value changes digit count
- **No Dock icon, no window**: `ActivationPolicy::Accessory` — it exists only in the menu bar
- **No background threads**: a single main-thread `tao` event loop with `ControlFlow::WaitUntil` timer wakes — even sysinfo's rayon pool is compiled out
- **Launch at login toggle**: right-click menu check item backed by `SMAppService` (when running as the `.app` bundle)
- **Flat memory by design**: one `Sampler` owns all sampling state, one `Renderer` owns all drawing state; every tick's ObjC temporaries die in an explicit autorelease pool
- **Measured footprint**: 11 MB at launch, settling at a flat ~20 MB steady state (`phys_footprint`, the Activity Monitor number) on an M-series MacBook Pro — soak-profiled leak-free with `leaks` (live heap ~6.5 MB; the rest is one-time allocator high-water, and it stops moving)
- **Modular metrics**: adding a stat is an enum variant + a match arm — nothing else changes
- **Tiny binary**: ~800 KB release build (`opt-level = "z"`, LTO, stripped)
```mermaid
flowchart LR
T["Timer wake
(every 2s)"] --> S["Sampler
one owner, no allocation"]
S --> C["CPU % + temp
sysinfo"]
S --> R["RAM %
sysinfo"]
S --> P["Power W
starship-battery"]
C --> O["Renderer
two color-coded lines
drawn into the status icon"]
R --> O
P --> O
O --> T
```
___
1. Requirements
- macOS on Apple Silicon (M-series)
- Rust **1.89+** (required by `starship-battery`)
2. Installation
#### As an .app bundle (recommended — enables the launch-at-login toggle)
```bash
git clone https://github.com/nim444/featherbar.git
cd featherbar
# Build the release binary and assemble Featherbar.app (ad-hoc signed)
./scripts/bundle.sh
cp -R target/Featherbar.app /Applications/
open /Applications/Featherbar.app
```
#### As a bare binary
```bash
# From crates.io
cargo install featherbar
featherbar
# Or from a checkout
cargo run --release
```
The reading appears in your menu bar immediately. There is no Dock icon and no window — right-click the menu-bar text for the menu and **Quit**.
#### Launch at login
Right-click the menu-bar reading and check **Launch at login**. The toggle uses Apple's `SMAppService` API, which only works from a real `.app` bundle — from a bare `cargo run` binary the item is shown disabled. Verify the registration anytime in **System Settings → General → Login Items**.
3. Project Structure
```
├── src/
│ ├── main.rs # Metric enum, Sampler, thresholds, event loop, menu
│ ├── two_line.rs # Renderer: two color-coded lines drawn into the icon
│ └── login_item.rs # Launch-at-login via SMAppService
├── scripts/
│ └── bundle.sh # Assemble Featherbar.app from the release binary
├── assets/
│ └── menubar.png
├── Cargo.toml # size-optimized release profile, trimmed features
├── Cargo.lock
├── LICENSE # Apache-2.0
└── README.md
```
Three source files on purpose. The app is small enough that splitting it up further would only add indirection.
4. How It Works
The hard macOS constraints this design satisfies:
- The `tao` event loop must run on the **main thread**, and the tray icon must be created on that same thread.
- The tray icon is created **after the loop is running** — on `StartCause::Init`, not before.
- `ActivationPolicy::Accessory` keeps it out of the Dock and the app switcher.
The loop itself:
1. `StartCause::Init` — create the tray icon, locate its `NSStatusBarButton`, draw the first reading, arm a 2s `ControlFlow::WaitUntil` timer.
2. `StartCause::ResumeTimeReached` — drain the menu-event channel (Quit? login toggle?), take one sample per enabled metric, redraw, re-arm.
3. Nothing else. No threads, no channels to background workers, no history buffers.
**Why the display is an image:** NSStatusItem text titles are vertically centered by the button cell with no working override, and a single-line title can't stack two rows. So the `Renderer` draws both lines into an `NSImage` each tick — glyph positions computed from real font metrics (cap height, descent), colors per severity, Retina-sharp. The button can't fight pixels.
**Why memory stays flat:** one `Sampler` owns the `sysinfo::System` (created empty — no process table), the component list, and a single battery handle refreshed in place; one `Renderer` owns the font and four prebuilt attribute dictionaries. Per tick only the strings and the image are created, and an explicit `autoreleasepool` kills them before the loop sleeps again. The footprint rises from 11 MB at launch to ~20 MB as the malloc zones reach their high-water mark, then stops: a profiled soak shows ~6.5 MB live heap, no featherbar leaks, and a flat line from there.
Measure it yourself while it runs (same metric Activity Monitor shows):
```bash
footprint $(pgrep -x featherbar)
# featherbar [pid]: 64-bit Footprint: 11 MB (launch; settles at ~20 MB and stays flat)
```
5. Adding a Metric
Three edits, all in `src/main.rs`:
```rust
// 1. Add a variant
enum Metric {
Ram,
Cpu,
Power,
Temp,
DiskFree, // new
}
// 2. Add a match arm in Sampler::fragment that pushes label/value Segs
Metric::DiskFree => {
out.push(Seg::new("D", Level::Neutral));
out.push(Seg::new(format!("{}G", pad(free_gb, 3, 0)), disk_level(free_gb)));
}
// 3. Put it on a line
const LINE_TOP: &[Metric] = &[Metric::Cpu, Metric::Power];
const LINE_BOTTOM: &[Metric] = &[Metric::Ram, Metric::Temp, Metric::DiskFree];
```
Good candidates with maintained crates and no reverse engineering: network up/down (`sysinfo` networks), disk free (`sysinfo` disks), battery % (`starship_battery`).
6. Behavior Notes (not bugs)
- **Power reads `0W` on AC or at full charge.** The watt figure is the battery charge/discharge rate (`energy_rate`), so it is only meaningful while running on battery. It is NOT total system/SoC power.
- **Power may read `0W` for a minute right after unplugging.** The battery fuel gauge reports `InstantAmperage = 0` until real discharge current registers — featherbar shows exactly what the SMC reports. Verify the OS-side value with `ioreg -rn AppleSmartBattery | grep InstantAmperage`.
- **`—W` is shown** when no battery is available; **`—°C`** when no die sensor is found.
- **Temperature is the hottest CPU die sensor** (`PMU tdie*`), which is what "CPU temp" colloquially means — individual sensors run cooler.
- **The first CPU sample may be off** for one tick until the second refresh lands.
7. Scope — what featherbar will not do
Fans and total SoC/package power are **out of scope**. They require undocumented IOKit/SMC keys that break with each new Apple Silicon generation — the exact maintenance treadmill this project exists to avoid. (CPU temperature *is* shown, but through `sysinfo`'s maintained Components API — the PMU die sensors — not hand-rolled SMC keys.) If you need fans or package watts, [Stats](https://github.com/exelban/stats) does them well and pays that maintenance cost for you.
8. Tech Stack
| Layer | Crate |
|---|---|
| Menu-bar icon (NSStatusItem) | `tray-icon` 0.21 |
| Main-thread event loop | `tao` 0.34 |
| RAM / CPU sampling | `sysinfo` 0.33 |
| Battery power draw | `starship-battery` 0.10 |
Release profile: `opt-level = "z"`, `lto = true`, `strip = true` → ~800 KB binary.
## Roadmap
- SMC `PSTR` (system total power) reader behind `Metric::Power`, with fallback to battery watts — total consumption with or without AC, accepting the undocumented-key tradeoff
- Network up/down and disk-free metrics
- A settings menu to toggle which metrics are shown at runtime
____
[](LICENSE)