https://github.com/nmelgar/lego_my_data
Data visualization project to sell LEGO bulks.
https://github.com/nmelgar/lego_my_data
csv data-analysis data-visualization data-viz google-sheets tableau
Last synced: 6 months ago
JSON representation
Data visualization project to sell LEGO bulks.
- Host: GitHub
- URL: https://github.com/nmelgar/lego_my_data
- Owner: nmelgar
- Created: 2023-01-21T18:42:08.000Z (over 3 years ago)
- Default Branch: main
- Last Pushed: 2023-01-28T19:17:34.000Z (over 3 years ago)
- Last Synced: 2025-02-05T15:46:07.762Z (over 1 year ago)
- Topics: csv, data-analysis, data-visualization, data-viz, google-sheets, tableau
- Homepage:
- Size: 224 KB
- Stars: 0
- Watchers: 1
- Forks: 0
- Open Issues: 0
-
Metadata Files:
- Readme: README.md
Awesome Lists containing this project
README
# LEGO My Data
We will be selling bulk LEGO in 1 lb. bags. The more organized the bricks, the better they will sell.
## Background
LEGO has become one of the most valuable toys on the planet. You can even download software and create your own sets from LeoCAD
Links to an external site..
We will be selling bulk LEGO in 1 lb. bags. According to LEGO selling guide
Links to an external site., the more organized the bricks are the better they will sell. While most eBayers take a couple of photos and list the number of pounds to sell their project, we will be selling our bags of LEGO with data visualizations. If you would like more details about each brick you can find them at BrickLink.
## The Challenge
We will record information on the first 100 LEGO bricks in our bag (such as color). Then, use the recorded data to create data visualizations to promote the product. The visualizations should provide an accurate description of the LEGOs without the customers handling or seeing the product (no pictures of LEGO's bags).
Data visualizations should also answer questions the buyers might have. Some example questions are listed below.
How many slanted bricks do you have?
What is the distribution of colors available in your set?
What is the total area by color?
## Results
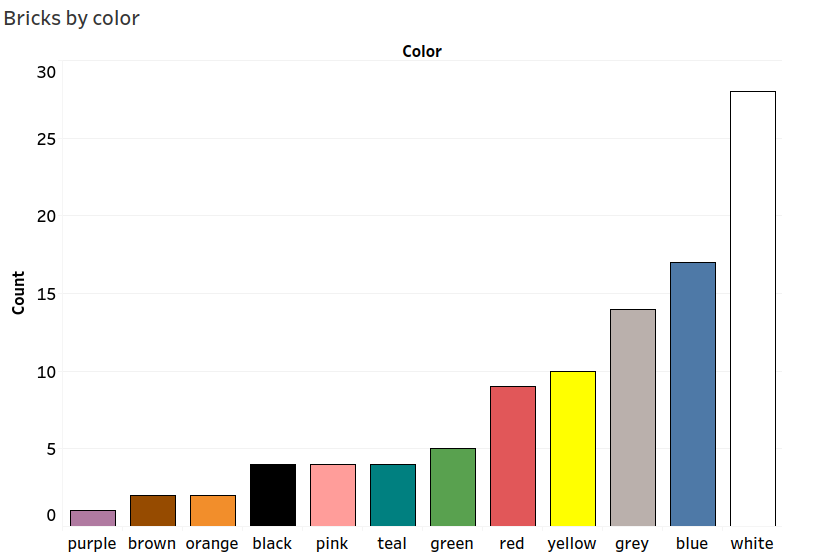
There are 100 LEGO bricks in this bulk. It is essential to know how many bricks of each color are contained in the bulk. The following bar chart will allow the user to better decide if he/she need this bulk, or if she/he needs other bulk with more bricks of a different color (e.g. blue bricks).
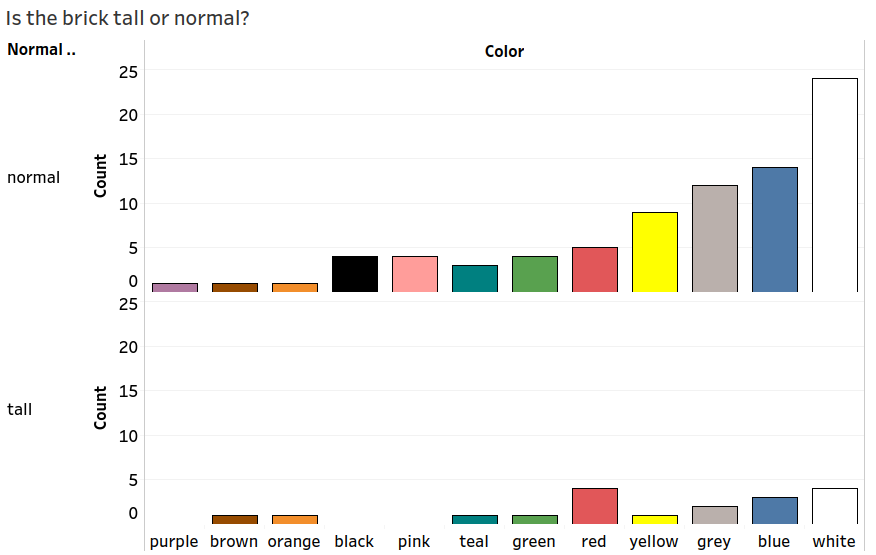
This chart will display the amount of bricks of each color, describing if they are normal or tall. Sometimes the user will need more tall bricks than normal ones.
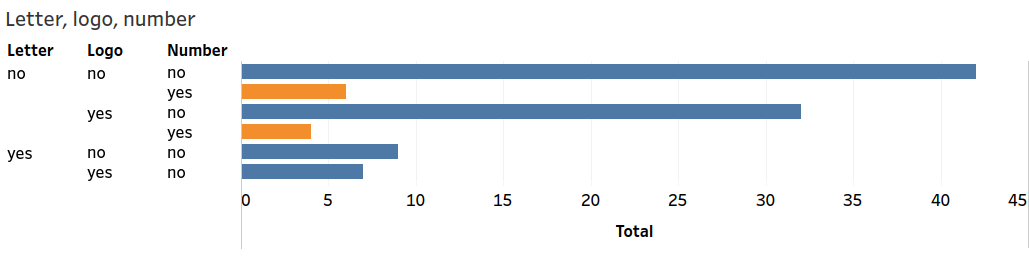
This chart will display and separate all the bricks of the bulk. The criteria is, does the brick have a letter, logo or number? Users will find useful to have bricks without any of these elements on them.
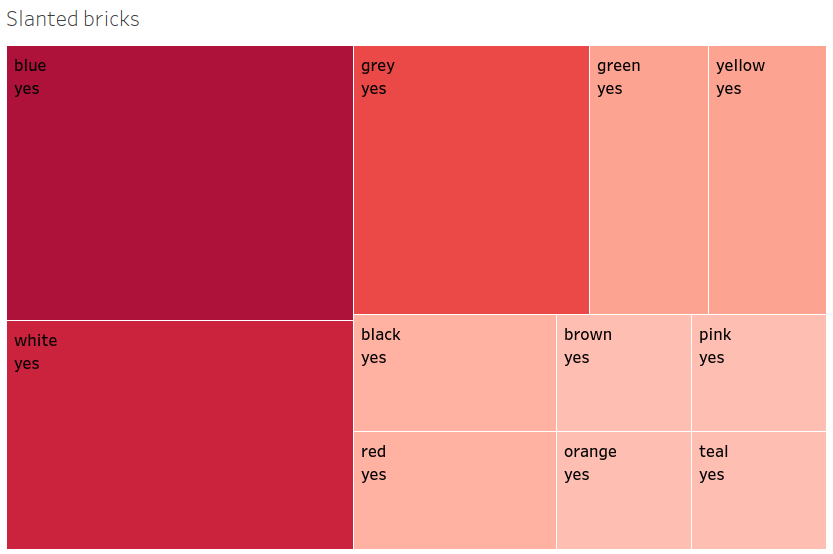
This heat map will display the slanted bricks with their corresponding color. The higher the saturation the higher amount of slanted bricks of that color.
## Conclusion
Customers/users need to know different aspects of the bulks before making a purchase, they will find useful this information to better decide wheter they need or not a specific bulk.