https://github.com/nschloe/perfplot
:chart_with_upwards_trend: Performance analysis for Python snippets
https://github.com/nschloe/perfplot
performance-analysis python
Last synced: 12 months ago
JSON representation
:chart_with_upwards_trend: Performance analysis for Python snippets
- Host: GitHub
- URL: https://github.com/nschloe/perfplot
- Owner: nschloe
- License: gpl-3.0
- Created: 2017-02-21T13:22:21.000Z (about 9 years ago)
- Default Branch: main
- Last Pushed: 2024-11-14T19:53:40.000Z (over 1 year ago)
- Last Synced: 2025-04-12T12:47:00.874Z (about 1 year ago)
- Topics: performance-analysis, python
- Language: Python
- Homepage:
- Size: 937 KB
- Stars: 1,367
- Watchers: 17
- Forks: 63
- Open Issues: 16
-
Metadata Files:
- Readme: README.md
- License: LICENSE
Awesome Lists containing this project
README
[](https://pypi.org/project/perfplot)
[](https://pypi.org/pypi/perfplot/)
[](https://github.com/nschloe/perfplot)
[](https://pepy.tech/project/perfplot)
[](https://discord.gg/hnTJ5MRX2Y)
[](https://github.com/nschloe/perfplot/actions?query=workflow%3Aci)
[](https://codecov.io/gh/nschloe/perfplot)
[](https://lgtm.com/projects/g/nschloe/perfplot)
[](https://github.com/psf/black)
perfplot extends Python's [timeit](https://docs.python.org/3/library/timeit.html) by
testing snippets with input parameters (e.g., the size of an array) and plotting the
results.
For example, to compare different NumPy array concatenation methods, the script
```python
import numpy as np
import perfplot
perfplot.show(
setup=lambda n: np.random.rand(n), # or setup=np.random.rand
kernels=[
lambda a: np.c_[a, a],
lambda a: np.stack([a, a]).T,
lambda a: np.vstack([a, a]).T,
lambda a: np.column_stack([a, a]),
lambda a: np.concatenate([a[:, None], a[:, None]], axis=1),
],
labels=["c_", "stack", "vstack", "column_stack", "concat"],
n_range=[2**k for k in range(25)],
xlabel="len(a)",
# More optional arguments with their default values:
# logx="auto", # set to True or False to force scaling
# logy="auto",
# equality_check=np.allclose, # set to None to disable "correctness" assertion
# show_progress=True,
# target_time_per_measurement=1.0,
# max_time=None, # maximum time per measurement
# time_unit="s", # set to one of ("auto", "s", "ms", "us", or "ns") to force plot units
# relative_to=1, # plot the timings relative to one of the measurements
# flops=lambda n: 3*n, # FLOPS plots
)
```
produces
|  |  |
| -------------------------------------------------- | ---------------------------------------------------- |
Clearly, `stack` and `vstack` are the best options for large arrays.
(By default, perfplot asserts the equality of the output of all snippets, too.)
If your plot takes a while to generate, you can also use
```python
perfplot.live(
# ...
)
```

with the same arguments as above. It will plot the updates live.
Benchmarking and plotting can be separated. This allows multiple plots of the same data,
for example:
```python
out = perfplot.bench(
# same arguments as above (except the plot-related ones, like time_unit or log*)
)
out.show()
out.save("perf.png", transparent=True, bbox_inches="tight")
```
Other examples:
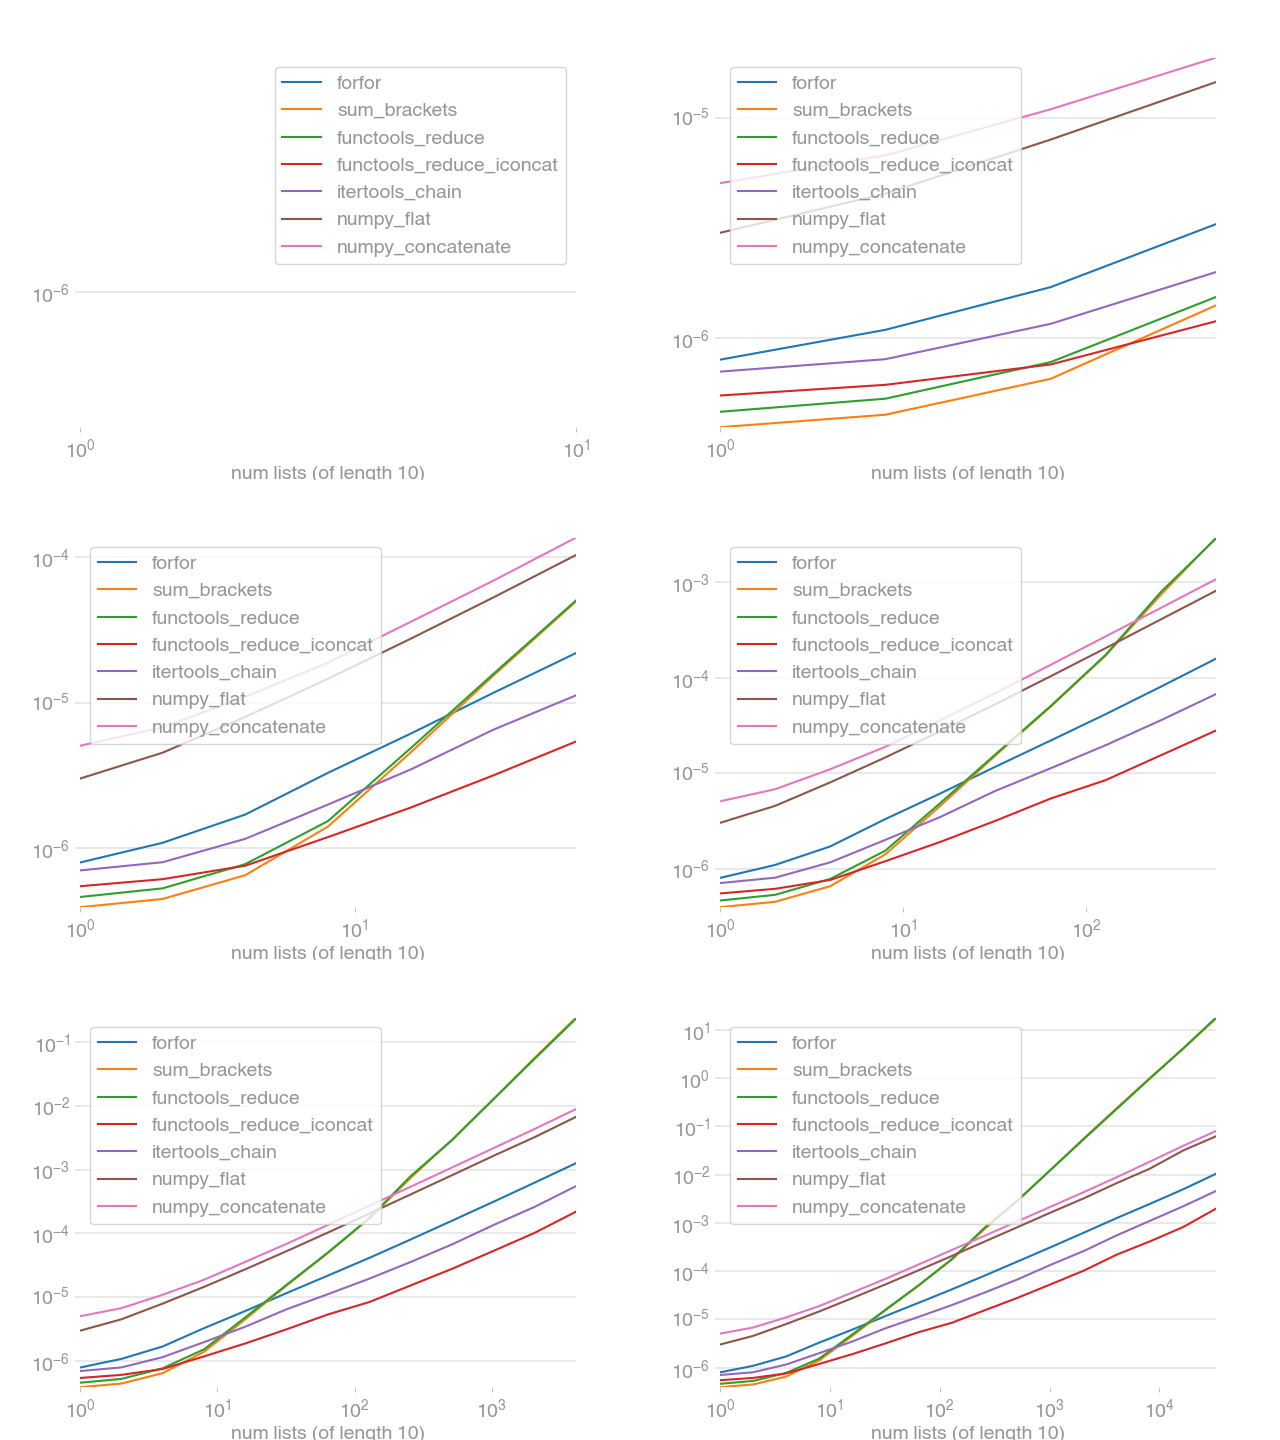
- [Making a flat list out of list of lists in Python](https://stackoverflow.com/a/45323085/353337)
- [Most efficient way to map function over numpy array](https://stackoverflow.com/a/46470401/353337)
- [numpy: most efficient frequency counts for unique values in an array](https://stackoverflow.com/a/43096495/353337)
- [Most efficient way to reverse a numpy array](https://stackoverflow.com/a/44921013/353337)
- [How to add an extra column to an numpy array](https://stackoverflow.com/a/40218298/353337)
- [Initializing numpy matrix to something other than zero or one](https://stackoverflow.com/a/45006691/353337)
### Installation
perfplot is [available from the Python Package
Index](https://pypi.org/project/perfplot/), so simply do
```
pip install perfplot
```
to install.
### Testing
To run the perfplot unit tests, check out this repository and type
```
tox
```
### License
This software is published under the [GPLv3 license](https://www.gnu.org/licenses/gpl-3.0.en.html).