https://github.com/nschloe/termplotlib
:chart_with_upwards_trend: Plotting on the command line
https://github.com/nschloe/termplotlib
ascii-chart command-line plot plotting pypi python terminal
Last synced: over 1 year ago
JSON representation
:chart_with_upwards_trend: Plotting on the command line
- Host: GitHub
- URL: https://github.com/nschloe/termplotlib
- Owner: nschloe
- License: gpl-3.0
- Created: 2018-06-10T11:55:36.000Z (about 8 years ago)
- Default Branch: main
- Last Pushed: 2021-12-09T00:04:42.000Z (over 4 years ago)
- Last Synced: 2025-04-01T12:03:32.538Z (over 1 year ago)
- Topics: ascii-chart, command-line, plot, plotting, pypi, python, terminal
- Language: Python
- Homepage:
- Size: 370 KB
- Stars: 687
- Watchers: 10
- Forks: 18
- Open Issues: 10
-
Metadata Files:
- Readme: README.md
- License: LICENSE.txt
Awesome Lists containing this project
README
# termplotlib
[](https://pypi.org/project/termplotlib)
[](https://pypi.org/pypi/termplotlib/)
[](https://github.com/nschloe/termplotlib)
[](https://pypistats.org/packages/termplotlib)
[](https://github.com/nschloe/termplotlib/actions?query=workflow%3Aci)
[](https://codecov.io/gh/nschloe/termplotlib)
[](https://lgtm.com/projects/g/nschloe/termplotlib)
[](https://github.com/psf/black)
termplotlib is a Python library for all your terminal plotting needs. It aims to work
like [matplotlib](https://matplotlib.org/).
### Line plots
For line plots, termplotlib relies on [gnuplot](http://www.gnuplot.info/).
With that installed, the code
```python
import termplotlib as tpl
import numpy as np
x = np.linspace(0, 2 * np.pi, 10)
y = np.sin(x)
fig = tpl.figure()
fig.plot(x, y, label="data", width=50, height=15)
fig.show()
```
produces
```
1 +---------------------------------------+
0.8 | ** ** |
0.6 | * ** data ******* |
0.4 | ** |
0.2 |* ** |
0 | ** |
| * |
-0.2 | ** ** |
-0.4 | ** * |
-0.6 | ** |
-0.8 | **** ** |
-1 +---------------------------------------+
0 1 2 3 4 5 6 7
```
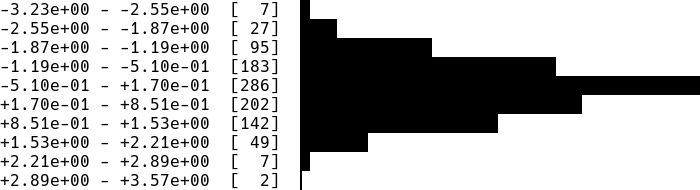
### Horizontal histograms
```python
import termplotlib as tpl
import numpy as np
rng = np.random.default_rng(123)
sample = rng.standard_normal(size=1000)
counts, bin_edges = np.histogram(sample)
fig = tpl.figure()
fig.hist(counts, bin_edges, orientation="horizontal", force_ascii=False)
fig.show()
```
produces
Horizontal bar charts are covered as well. This
```python
import termplotlib as tpl
fig = tpl.figure()
fig.barh([3, 10, 5, 2], ["Cats", "Dogs", "Cows", "Geese"], force_ascii=True)
fig.show()
```
produces
```
Cats [ 3] ************
Dogs [10] ****************************************
Cows [ 5] ********************
Geese [ 2] ********
```
### Vertical histograms
```python
import termplotlib as tpl
import numpy as np
rng = np.random.default_rng(123)
sample = rng.standard_normal(size=1000)
counts, bin_edges = np.histogram(sample, bins=40)
fig = tpl.figure()
fig.hist(counts, bin_edges, grid=[15, 25], force_ascii=False)
fig.show()
```
produces

### Tables
Support for tables has moved over to
[termtables](https://github.com/nschloe/termtables).
### Installation
termplotlib is [available from the Python Package
Index](https://pypi.org/project/termplotlib/), so simply do
```
pip install termplotlib
```
to install.
### Testing
To run the termplotlib unit tests, check out this repository and type
```
pytest
```
### Similar projects
- [asciichart](https://github.com/kroitor/asciichart)
- [bashplotlib](https://github.com/glamp/bashplotlib)
- [plotext](https://github.com/piccolomo/plotext)
- [plotille](https://github.com/tammoippen/plotille)