https://github.com/nvidia-isaac-ros/ros2_benchmark
Benchmark the performance of your ROS 2 graphs
https://github.com/nvidia-isaac-ros/ros2_benchmark
benchmarking performance performance-testing ros2 ros2-humble
Last synced: 5 months ago
JSON representation
Benchmark the performance of your ROS 2 graphs
- Host: GitHub
- URL: https://github.com/nvidia-isaac-ros/ros2_benchmark
- Owner: NVIDIA-ISAAC-ROS
- License: apache-2.0
- Created: 2023-03-28T22:02:31.000Z (over 3 years ago)
- Default Branch: main
- Last Pushed: 2025-12-11T06:15:49.000Z (7 months ago)
- Last Synced: 2026-01-26T19:51:29.535Z (6 months ago)
- Topics: benchmarking, performance, performance-testing, ros2, ros2-humble
- Language: Python
- Homepage: https://catalog.ngc.nvidia.com/orgs/nvidia/teams/isaac/resources/r2bdataset2023
- Size: 277 KB
- Stars: 121
- Watchers: 7
- Forks: 17
- Open Issues: 2
-
Metadata Files:
- Readme: README.md
- Contributing: CONTRIBUTING.md
- License: LICENSE
- Security: SECURITY.md
Awesome Lists containing this project
README
# ros2_benchmark

## Overview
Robots are real-time systems which require complex graphs of heterogeneous computation to perform perception, planning, and control. These graphs of computation need to perform work deterministically and with known latency. The computing platform has a fixed budget for heterogeneous computation (TOPS) and throughput; computation is typically performed on multiple CPUs, GPUs, and additional special purpose, fixed function hardware accelerators.
`ros2_benchmark` provides the tools for measuring the throughput, latency, and compute utilization of these complex graphs without altering the code under test. The results can be used to make informed design decisions on how best a robotics application can meet its real-time requirements. Results can be used to optimize system performance by tracking results over time against changes in the implementation and can be used in the development of program flow monitors to detect anomalies during operation of the real-time robotics application.
This tooling allows for realistic assessments of robotics application performance under load including message transport costs in [RCL](https://github.com/ros2/rclcpp) for practical benchmarking indicative of your real-world results. Message transport costs can be measured intra-process or inter-process including DDS overhead with support for [type adaptation](https://ros.org/reps/rep-2007.html). This tooling does not require modification of the graph of nodes under test to measure results, allowing both open source and proprietary solutions to be measured with the same tools in an non-intrusive way. Input for benchmarking is standardized with available rosbag datasets accompanying this package.
Designed for local developer use or in CI/CD platforms, these tools can be containerized to run on cloud native platforms such as Kubernetes. The tools are commercially hardened over tens of thousands of runs. We use this nightly on 7 hardware platforms using `aarch64` and `x86_64` architectures on multiple graph configurations.

ros2_benchmark uses the benchmark controller to orchestrate the data loader, playback and monitor nodes to perform benchmark runs, and calculate performance results into a benchmark report.
The data loader node fetches input data from rosbag. Input data is pre-processed using a configurable graph of nodes, and buffered into memory in the playback node which supports a plug-in for type adaptation. The graph benchmarked runs unmodified with input from the playback node controlling the data rate to output received at the monitor node.

ros2_benchmark loads data from rosbag(s), performs any data pre-processing using a graph of ros nodes, and buffers the input data for benchmarking. If measuring peak throughput, the auto finder runs the graph under benchmark at multiple publisher rates to find the maximum publisher rate with less than 5% drops through the graph, otherwise it uses the specified fixed publishing rate or the timing from the rosbag.
The graph under benchmark is measured multiple times, with calculated results in a benchmark report.
## Table of Contents
- [ros2\_benchmark](#ros2_benchmark)
- [Overview](#overview)
- [Table of Contents](#table-of-contents)
- [Latest Update](#latest-update)
- [Supported Platforms](#supported-platforms)
- [Quickstart](#quickstart)
- [Datasets](#datasets)
- [r2b Dataset 2024](#r2b-dataset-2024)
- [r2b Dataset 2023](#r2b-dataset-2023)
- [Results](#results)
- [Example Results](#example-results)
- [Explanation of the Results JSON Format](#explanation-of-the-results-json-format)
- [Creating Custom Benchmark](#creating-custom-benchmark)
- [Profiling](#profiling)
- [Live Benchmark Mode](#live-benchmark-mode)
- [Updates](#updates)
## Latest Update
Update 2023-11-16: Add support for live benchmark mode
## Supported Platforms
This package is designed and tested to be compatible aarch64 and x86_64 platforms using ROS 2 Humble.
| Platform hardware | Platform software | ROS Version |
| ------------------- | --------------------------------------------------- | --------------------------------------------------------- |
| aarch64
x86_64 | [Ubuntu 20.04+](https://releases.ubuntu.com/20.04/) | [ROS 2 Humble](https://docs.ros.org/en/humble/index.html) |
> **Note**: `ros2_benchmark` has been tested on multiple computing platforms including [Intel NUC Corei7 11th Gen](https://ark.intel.com/content/www/us/en/ark/products/228816/intel-nuc-11-enterprise-edge-compute-nuc11tnhv70l.html) and [Jetson Orin](https://www.nvidia.com/en-us/autonomous-machines/embedded-systems/jetson-orin/).
## Quickstart
To use and learn to use `ros2_benchmark`, start by running a sample benchmark. Follow the steps below to start measuring the performance of an AprilTag node with `ros2_benchmark`.
1. Install ROS 2 Humble natively (see [here](https://docs.ros.org/en/humble/Installation.html)) or launch official Docker container with ROS 2 Humble pre-installed:
```bash
docker run -it ros:humble
```
2. Setup convenience environment variables and install tools.
```bash
export R2B_WS_HOME=~/ros_ws && \
export ROS2_BENCHMARK_OVERRIDE_ASSETS_ROOT=$R2B_WS_HOME/src/ros2_benchmark/assets && \
sudo apt-get update && sudo apt-get install -y git git-lfs wget
```
3. Clone this repository along with an available implementation of Apriltag detection and install dependencies.
```bash
mkdir -p $R2B_WS_HOME/src && cd $R2B_WS_HOME/src && \
git clone https://github.com/NVIDIA-ISAAC-ROS/ros2_benchmark.git && \
git clone https://github.com/christianrauch/apriltag_ros.git && \
cd $R2B_WS_HOME && \
sudo apt-get update && \
rosdep update && rosdep install -i -r --from-paths src --rosdistro humble -y
```
4. Clone and build `image_proc` package with patch to fix incompatible QoS settings.
```bash
cd $R2B_WS_HOME/src && \
git clone https://github.com/ros-perception/vision_opencv.git && cd vision_opencv && git checkout humble && \
cd $R2B_WS_HOME/src && \
git clone https://github.com/ros-perception/image_pipeline.git && cd image_pipeline && git checkout humble && \
git config user.email "benchmarking@ros2_benchmark.com" && git config user.name "ROS 2 Developer" && \
wget https://raw.githubusercontent.com/NVIDIA-ISAAC-ROS/ros2_benchmark/main/resources/patch/resize_qos_profile.patch && \
git apply resize_qos_profile.patch && \
cd $R2B_WS_HOME && \
sudo apt-get update && \
rosdep update && rosdep install -i -r --from-paths src --rosdistro humble -y && \
colcon build --packages-up-to image_proc
```
5. Pull down `r2b dataset 2023` by following the instructions [here](#datasets) or fetch just the rosbag used in this Quickstart with the following command.
```bash
mkdir -p $R2B_WS_HOME/src/ros2_benchmark/assets/datasets/r2b_dataset/r2b_storage && \
cd $R2B_WS_HOME/src/ros2_benchmark/assets/datasets/r2b_dataset/r2b_storage && \
wget 'https://api.ngc.nvidia.com/v2/resources/nvidia/isaac/r2bdataset2023/versions/2/files/r2b_storage/metadata.yaml' && \
wget 'https://api.ngc.nvidia.com/v2/resources/nvidia/isaac/r2bdataset2023/versions/2/files/r2b_storage/r2b_storage_0.db3'
```
6. Build `ros2_benchmark` and source the workspace:
```bash
cd $R2B_WS_HOME && \
colcon build --packages-up-to ros2_benchmark apriltag_ros && \
source install/setup.bash
```
7. (Optional) Run tests to verify complete and correct installation:
```bash
colcon test --packages-select ros2_benchmark
```
8. Start the AprilTag benchmark:
```bash
launch_test src/ros2_benchmark/scripts/apriltag_ros_apriltag_node.py
```
Once the benchmark is finished, the final performance measurements are displayed in the terminal.
Additionally, the final results and benchmark metadata (e.g., system information, benchmark configurations) are also exported as a JSON file.
## Datasets
Input data for benchmarking is provided in a rosbag.
To provide consistency of results, we have provided multiple dataset sequences in rosbag for use with `ros2_benchmark`; input data in other rosbag(s) can be used. These dataset sequences were captured on a robot, using very high precision time synchronization between sensors. Captured sensor data includes [HAWK (2mp RGB stereo camera with IMU)](https://www.leopardimaging.com/li-ar0234cs-stereo-gmsl2-hawk/), [D455](https://realsenseai.com/stereo-depth-cameras/real-sense-depth-camera-d455/) and [XT32](https://www.hesaitech.com/product/xt32/).
These datasets are explicitly **not** provided inside this repository. Instead, visit NGC to download the dataset [here](https://catalog.ngc.nvidia.com/orgs/nvidia/teams/isaac/collections/r2bdataset).
You can also download the datasets with command-line tools as follows by first installing the NGC CLI.
```bash
wget --content-disposition https://ngc.nvidia.com/downloads/ngccli_linux.zip && unzip ngccli_linux.zip && chmod u+x ngc-cli/ngc
```
With the NGC CLI available, you can download the datasets with the following commands:
```bash
./ngc-cli/ngc registry resource download-version "nvidia/isaac/r2bdataset2023:3"
./ngc-cli/ngc registry resource download-version "nvidia/isaac/r2bdataset2024:1"
```
Then, move the datasets to their required location:
```bash
mkdir assets/datasets/r2b_dataset
mv r2bdataset2023_v3/* assets/datasets/r2b_dataset
mv r2bdataset2024_v1/* assets/datasets/r2b_dataset
```
### r2b Dataset 2024
| Sequence | Size | Visual | Contents | Description |
| -------------------------------------------------------------------------------------------------- | ---- | ----------------------------------------------------------------------------------------------------------------------------------------------------------------------------------------- | --------------------------------------------------------------------------------------------------------------------------------- | ------------------------------------------------------------------------------------------------------ |
| [r2b_galileo](https://catalog.ngc.nvidia.com/orgs/nvidia/teams/isaac/resources/r2bdataset2024) | 471M | 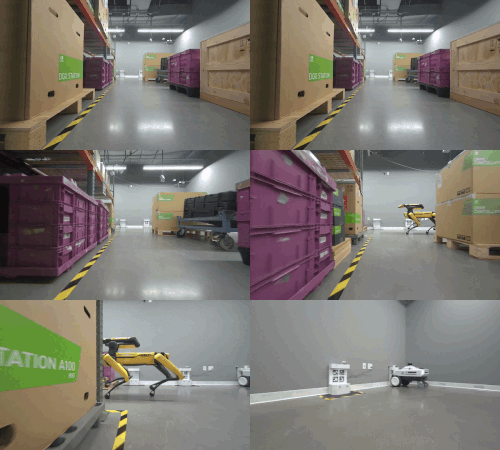 | 4x LI HAWK stereo
L+R 1920x1200 RGB 30fps
IMU
Wheel odometry | Room sequence including robots, shelving, boxes, pallets, with moving obstacles. |
| [r2b_galileo2](https://catalog.ngc.nvidia.com/orgs/nvidia/teams/isaac/resources/r2bdataset2024) | 986M | 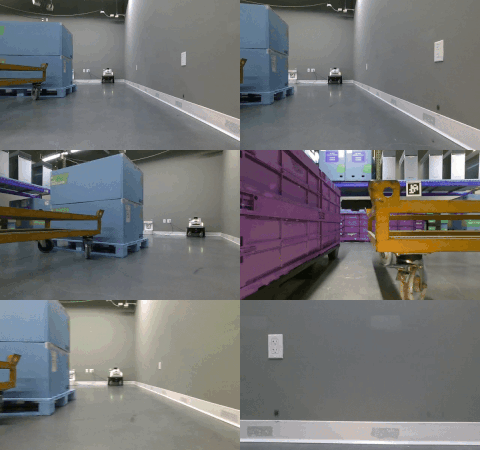 | RealSense D455
L+R 1280x720 IR Mono 30fps
Depth 1280x780 30fps
1280x800 RGB 30fps
IMU
Wheel odometry | Room sequence including robots, shelving, boxes, pallets, with moving obstacles. |
| [r2b_robotarm](https://catalog.ngc.nvidia.com/orgs/nvidia/teams/isaac/resources/r2bdataset2024) | 1.4G | 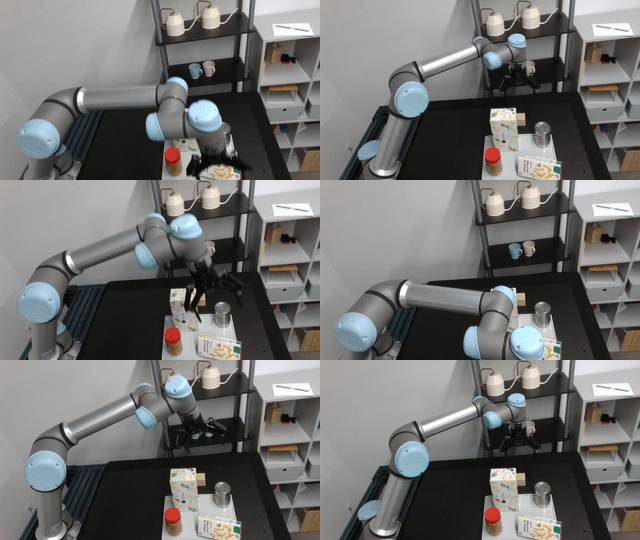 | RealSense D455
L+R 1280x720 IR Mono 30fps
Depth 1280x780 30fps
1280x800 RGB 30fps
Robot joint states | Robot arm sequence containing objects on a tray. |
| [r2b_whitetunnel](https://catalog.ngc.nvidia.com/orgs/nvidia/teams/isaac/resources/r2bdataset2024) | 503M | 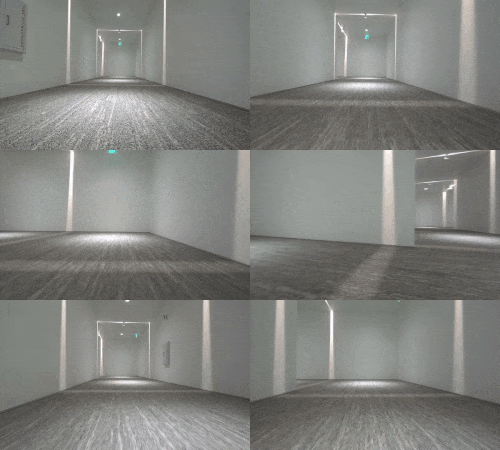 | 4x LI HAWK stereo
L+R 1920x1200 RGB 30fps
IMU
Wheel odometry | Hallway sequence with low to no feature not-perpendicular walls, specular highlights, and reflections. |
### r2b Dataset 2023
| Sequence | Size | Visual | Contents | Description |
| ------------------------------------------------------------------------------------------------- | ---- | ------------------------------------------------------------------------------------------ | ------------------------------------------------------------------------------------------------------------------------------------------------------------------------------ | -------------------------------------------------------------------------------------------------------------------------------------------------------------------------------------------------- |
| [r2b_lounge](https://catalog.ngc.nvidia.com/orgs/nvidia/teams/isaac/resources/r2bdataset2023) | 3.9G |  | LI HAWK stereo
L+R 1920x1200 RGB 30fps
RealSense D455
L+R 1280x720 Mono IR 30fps
Depth 1280x780 30fps
1280x800 RGB 30fps
Hesai XT32 10Hz
| Lounge sequence containing couch, table, chairs, and staircase with natural planted background wall. |
| [r2b_storage](https://catalog.ngc.nvidia.com/orgs/nvidia/teams/isaac/resources/r2bdataset2023) | 2.9G |  | LI HAWK stereo
L+R 1920x1200 RGB 30fps
RealSense D455
L+R 1280x720 IR Mono 30fps
Depth 1280x780 30fps
1280x800 RGB 30fps
Hesai XT32 10Hz
| Storage sequence including person, AprilTag, shoe, shelving, boxes, pallets | skids, dollys, robots, boundary floor tape, calibration target, and color checker, with 50% reflective background grey walls. |
| [r2b_hallway](https://catalog.ngc.nvidia.com/orgs/nvidia/teams/isaac/resources/r2bdataset2023) | 1.3G |  | LI HAWK stereo
L+R 1920x1200 RGB 30fps
RealSense D455
L+R 1280x720 Mono 30fps
Depth 1280x780 30fps
1280x800 RGB 30fps
Hesai XT32 10Hz
| Hallway sequence with walking persons, low to no feature not-perpendicular walls, specular highlights, and reflections. |
| [r2b_datacenter](https://catalog.ngc.nvidia.com/orgs/nvidia/teams/isaac/resources/r2bdataset2023) | 1.7G |  | LI HAWK stereo
L+R 1920x1200 RGB 30fps
RealSense D455
L+R 1280x720 Mono 30fps
Depth 1280x780 30fps
1280x800 RGB 30fps
Hesai XT32 10Hz
| Datacenter sequence with tall vertical corridor repetitive low-feature surfaces, little color. |
| [r2b_cafe](https://catalog.ngc.nvidia.com/orgs/nvidia/teams/isaac/resources/r2bdataset2023) | 1.2G |  | LI HAWK stereo
L+R 1920x1200 RGB 30fps
RealSense D455
L+R 1280x720 Mono 30fps
Depth 1280x780 IR 30fps
1280x800 RGB 30fps
Hesai XT32 10Hz
| Café sequence including table, chairs, stools, reflective flooring, dark reflective glass walls, specular highlights, low wall features, and vibration from floor surface. |
| [r2b_hope](https://catalog.ngc.nvidia.com/orgs/nvidia/teams/isaac/resources/r2bdataset2023) | 30M |  | D415 RGB | Image from [HOPE dataset](https://github.com/swtyree/hope-dataset/) for 6-DoF pose estimation from [scene 0005](https://github.com/swtyree/hope-dataset/tree/master/hope-image-preview/scene_0005) |
| [r2b_hideaway](https://catalog.ngc.nvidia.com/orgs/nvidia/teams/isaac/resources/r2bdataset2023) | 1.8G |  | LI HAWK stereo
L+R 1920x1200 RGB 30fps
RealSense D455
L+R 1280x720 IR Mono 30fps
Depth 1280x780 30fps
1280x800 RGB 30fps
Hesai XT32 10Hz
| Hideaway sequence including table, chairs, seated and moving persons specular highlights, low wall features, and vibration from floor surface. |
| [r2b_mezzanine](https://catalog.ngc.nvidia.com/orgs/nvidia/teams/isaac/resources/r2bdataset2023) | 2.0G |  | LI HAWK stereo
L+R 1920x1200 RGB 30fps
RealSense D455
L+R 1280x720 IR Mono 30fps
Depth 1280x780 30fps
1280x800 RGB 30fps
Hesai XT32 10Hz
| Mezzanine sequence including staircase, railings, table, chairs, highlights, low wall features, and vibration from floor surface. |
## Results
Performance measurements are output to a results JSON file. JSON provides a human-readable format which allows for traceable independently verifiable results and can be conveniently imported into your visualization tool of choice.
Default measurements include throughput, latency, and jitter. These measurements can be performed for the sample rate from the dataset sequence of the rosbag input, at peak throughput, and for fixed frequencies often to represent a sensor capture rate; for example 10hz for LIDAR or 30fps for camera.
Included in the log is information on the host system on which results were measured, when they were measured, and the corresponding software version. The input data used, and a hash of the input data file is reported for traceability of results. The input YAML configuration used for the benchmark run is reported allowing results to be independent reproduced with the same configuration.
> **Note**: We use the naming convention `_node` to represent a graph under test that contains a single node (for example, `stereo_image_proc_node.py`) and `_graph` to represent a graph of multiple nodes (for example, `stereo_image_proc_graph.py`).
### Example Results
The following are the performance results measured with `ros2_benchmark` on `aarch64` and `x86_64` platforms, using ROS 2 Humble in March 2023. The table below also contains links to the packages for the nodes used in the benchmark and to the complete results JSON files.
| Node | Input Size | Intel NUC Corei7 11th Gen | AGX Orin (CPU only) |
| ------------------------------------------------------------------------------------- | ---------- | ------------------------------------------------------------------------------ | ---------------------------------------------------------------------------- |
| [AprilTag Node](scripts/apriltag_ros_apriltag_node.py) | 720p | [90.8 fps](results/apriltag_ros_apriltag_node-nuc_4060ti.json)
11 ms | [56.3 fps](results/apriltag_ros_apriltag_node-agx_orin.json)
18 ms |
| [Rectify Node](scripts/image_proc_rectify_node.py) | 1080p | [539 fps](results/image_proc_rectify_node-nuc_4060ti.json)
1.9 ms | [185 fps](results/image_proc_rectify_node-agx_orin.json)
5.6 ms |
| [H.264 Encoder Node
I-frame Support](scripts/image_transport_h264_decoder_node.py) | 1080p | [60.5 fps](results/image_transport_h264_decoder_node-nuc_4060ti.json)
19 ms | [28.0 fps](results/image_transport_h264_decoder_node-agx_orin.json)
37 ms |
| [H.264 Encoder Node
P-frame Support](scripts/image_transport_h264_encoder_node.py) | 1080p | [43.4 fps](results/image_transport_h264_encoder_node-nuc_4060ti.json)
24 ms | [10.2 fps](results/image_transport_h264_encoder_node-agx_orin.json)
95 ms |
| [Stereo Disparity Node](scripts/stereo_image_proc_node.py) | 1080p | [99.5 fps](results/stereo_image_proc_node-nuc_4060ti.json)
6.4 ms | [66.5 fps](results/stereo_image_proc_node-agx_orin.json)
15 ms |
| Graph | Input Size | Intel NUC Corei7 11th Gen | AGX Orin (CPU only) |
| ------------------------------------------------------------ | ---------- | ------------------------------------------------------------------------ | ---------------------------------------------------------------------- |
| [AprilTag Graph](scripts/apriltag_ros_apriltag_graph.py) | 720p | [88.1 fps](results/apriltag_ros_apriltag_graph-nuc_4060ti.json)
12 ms | [56.3 fps](results/apriltag_ros_apriltag_graph-agx_orin.json)
22 ms |
| [Stereo Disparity Graph](scripts/stereo_image_proc_graph.py) | 1080p | [99.4 fps](results/stereo_image_proc_graph-nuc_4060ti.json)
16 ms | [63.5 fps](results/stereo_image_proc_graph-agx_orin.json)
28 ms |
> **Note**: All results above are using ROS 2 nodes from open source that run computation on the CPU only. For GPU-accelerated equivalent packages, see [Isaac ROS](https://github.com/NVIDIA-ISAAC-ROS/).
### Explanation of the Results JSON Format
After a `ros2_benchmark`-based benchmark is complete, the framework will output a detailed log of the results in a JSON format. This section explains that JSON format through the use of an example.
The first section of the output JSON file presents the results achieved running at the peak throughput, as identified by the harness' auto-tune search process. That peak throughput is logged with the key `MEAN_FRAME_RATE`; in this sample, the corresponding value is about ~6.09fps. This iteration of the test was run for `RECEIVED_DURATION = 4919.10` milliseconds. There were `NUM_MISSED_FRAMES = 20.0` frames dropped somewhere in `rclcpp` transport over the path that originates from the playback node, goes through the graph under test, and terminates in the monitor node.
```json
{
"BasicPerformanceMetrics.RECEIVED_DURATION": 4919.0,
"BasicPerformanceMetrics.MEAN_PLAYBACK_FRAME_RATE": 10.20338761907538,
"BasicPerformanceMetrics.MEAN_FRAME_RATE": 6.098802584821505,
"BasicPerformanceMetrics.NUM_MISSED_FRAMES": 20.0,
"BasicPerformanceMetrics.NUM_FRAMES_SENT": 50.0,
"BasicPerformanceMetrics.FIRST_SENT_RECEIVED_LATENCY": 29.333333333333332,
"BasicPerformanceMetrics.LAST_SENT_RECEIVED_LATENCY": 48.0,
"BasicPerformanceMetrics.MAX_JITTER": 231.0,
"BasicPerformanceMetrics.MIN_JITTER": 0.0,
"BasicPerformanceMetrics.MEAN_JITTER": 106.96428571428571,
"BasicPerformanceMetrics.STD_DEV_JITTER": 54.942484366766024,
"CPUProfilingMetrics.MAX_CPU_UTIL": 7.633333333333334,
"CPUProfilingMetrics.MIN_CPU_UTIL": 0.05555555555555555,
"CPUProfilingMetrics.MEAN_CPU_UTIL": 1.5159932659932658,
"CPUProfilingMetrics.STD_DEV_CPU_UTIL": 1.4090849674792143,
"CPUProfilingMetrics.BASELINE_CPU_UTIL": 2.1425925925925924,
}
```
The next section of results measures latency at a fixed input throughput of `10.0fps`, as indicated by the section header. In this case, `MEAN_PLAYBACK_FRAME_RATE = 10.2` fps indicates that the true input throughput achieved during the test was close but not exactly equal to the nominal value. The `MEAN_JITTER = 115` ms and `MAX_JITTER = 251` ms indicate the mean and max jitter, respectively. The value `MEAN_FRAME_RATE = 6.12` fps indicates that the output throughput of the graph was significantly slower than the input throughput; this corroborates the previous section's conclusion that the max sustainable frame rate is about ~6.09fps. This iteration of the test was run for `RECEIVED_DURATION = 4900` ms with `NUM_MISSED_FRAMES = 20` frames dropped somewhere in the `rclcpp` transport process.
Latency tests are often run at the processing rate for the graph under test. The playback rate can be tied to the sensor input rate; many LIDARs run at 10Hz, while cameras may run at 30fps or 60fps.
If desired, additional fixed playback rates can be specified to calculate additional latency measurements at multiple processing rates.
```json
{
"10.0fps": {
"BasicPerformanceMetrics.RECEIVED_DURATION": 4900,
"BasicPerformanceMetrics.MEAN_PLAYBACK_FRAME_RATE": 10.204081632653061,
"BasicPerformanceMetrics.MEAN_FRAME_RATE": 6.122448979591836,
"BasicPerformanceMetrics.NUM_MISSED_FRAMES": 20,
"BasicPerformanceMetrics.NUM_FRAMES_SENT": 50,
"BasicPerformanceMetrics.FIRST_SENT_RECEIVED_LATENCY": 23,
"BasicPerformanceMetrics.LAST_SENT_RECEIVED_LATENCY": 23,
"BasicPerformanceMetrics.MAX_JITTER": 251.0,
"BasicPerformanceMetrics.MIN_JITTER": 2.0,
"BasicPerformanceMetrics.MEAN_JITTER": 115.64285714285714,
"BasicPerformanceMetrics.STD_DEV_JITTER": 58.463183949824526,
"CPUProfilingMetrics.MAX_CPU_UTIL": 7.855555555555556,
"CPUProfilingMetrics.MIN_CPU_UTIL": 0.16666666666666666,
"CPUProfilingMetrics.MEAN_CPU_UTIL": 5.264444444444445,
"CPUProfilingMetrics.STD_DEV_CPU_UTIL": 2.9738969321351676,
"CPUProfilingMetrics.BASELINE_CPU_UTIL": 7.805555555555555,
}
}
```
Finally, the metadata provided at the end of the JSON file contains system and file information to provide a transparent and reproducible record of how the benchmark results were obtained. `BenchmarkMetadata.CONFIG` contains a copy of the configuration file YAML as a string. This configuration can be used to run a benchmark with identical parameters to those from the results file.
The name and checksum of the dataset used for the benchmark are also provided, ensuring that the same dataset has been used when comparing or reproducing independent results.
```json
{
"metadata": {
"BenchmarkMetadata.NAME": "reference AprilTagNode benchmark",
"BenchmarkMetadata.TEST_FILE_PATH": "/workspaces/ros-dev/src/ros2_benchmark/scripts/reference_apriltag_node_test.py",
"BenchmarkMetadata.TEST_DATETIME": "2023-03-15T22:07:43Z",
"BenchmarkMetadata.DEVICE_HOSTNAME": "neuromancer",
"BenchmarkMetadata.DEVICE_ARCH": "x86_64",
"BenchmarkMetadata.DEVICE_OS": "Linux 5.10.102.1-microsoft-standard-WSL2 #1 SMP Wed Mar 2 00:30:59 UTC 2022",
"BenchmarkMetadata.BENCHMARK_MODE": 1,
"BenchmarkMetadata.PEAK_THROUGHPUT_PREDICTION": 10.0,
"BenchmarkMetadata.INPUT_DATA_PATH": "assets/r2b_storage/r2b_storage.db3",
"BenchmarkMetadata.INPUT_DATA_HASH": "b7e276d5105397dfb19a6f2c6db7672f",
"BenchmarkMetadata.CONFIG": [copy of input config as stringified YAML]
}
}
```
> **Note**: The peak throughput of this sample run was capped at 10fps by the input configuation setting `"BenchmarkMetadata.PEAK_THROUGHPUT_PREDICTION": 10.0`.
## Creating Custom Benchmark
Benchmark your own graphs using `ros2_benchmark` framework by creating custom benchmark scripts from the minimum template shown below:
```python
from launch_ros.actions import ComposableNodeContainer
from launch_ros.descriptions import ComposableNode
from ros2_benchmark import ImageResolution
from ros2_benchmark import ROS2BenchmarkConfig, ROS2BenchmarkTest
def launch_setup(container_prefix, container_sigterm_timeout):
"""Graph setup for benchmarking your custom graph."""
# Insert your composable node declarations
# Required DataLoaderNode
data_loader_node = ComposableNode(
name='DataLoaderNode',
namespace=TestCustomGraph.generate_namespace(),
package='ros2_benchmark',
plugin='ros2_benchmark::DataLoaderNode',
# Insert remappings if necessary
)
# Insert your custom preprocessor graph if needed
# Required PlaybackNode
playback_node = ComposableNode(
name='PlaybackNode',
namespace=TestCustomGraph.generate_namespace(),
package='ros2_benchmark',
plugin='ros2_benchmark::PlaybackNode',
# Revise "data_formats" based on your graph
parameters=[{
'data_formats': [
'sensor_msgs/msg/Image',
'sensor_msgs/msg/CameraInfo'
],
}],
# Revise "remapping" based on your graph
remappings=[
('buffer/input0', 'data_loader_node/image'),
('input0', 'image'),
('buffer/input1', 'data_loader_node/camera_info'),
('input1', 'camera_info')
]
)
# Required MonitorNode
# You can add as many monitor nodes as you need to measure performance
# for multiple topics.
monitor_node = ComposableNode(
name='MonitorNode',
namespace=TestCustomGraph.generate_namespace(),
package='ros2_benchmark',
plugin='ros2_benchmark::MonitorNode',
parameters=[{
# Add "monitor_index" parameter to distinguish between various
# monitor nodes when multiple monitor nodes are used.
'monitor_data_format': 'apriltag_msgs/msg/AprilTagDetectionArray',
}],
# Revise "remapping" based on your graph
remappings=[
('output', 'apriltag_detections')
]
)
# Required composable node container
# Insert your composable nodes in the "composable_node_descriptions" list.
composable_node_container = ComposableNodeContainer(
name='container',
namespace=TestCustomGraph.generate_namespace(),
package='rclcpp_components',
executable='component_container_mt',
prefix=container_prefix,
sigterm_timeout=container_sigterm_timeout,
composable_node_descriptions=[
data_loader_node,
playback_node,
monitor_node,
# Insert custom nodes here
],
output='screen'
)
return [composable_node_container]
def generate_test_description():
return TestCustomGraph.generate_test_description_with_nsys(launch_setup)
class TestCustomGraph(ROS2BenchmarkTest):
"""Performance test for your custom graph."""
# Custom configurations
config = ROS2BenchmarkConfig(
# Insert your custom benchmark configurations
benchmark_name='Custom Graph Benchmark',
input_data_path='datasets/your_custom_rosbag_directory_path',
publisher_upper_frequency=100.0,
publisher_lower_frequency=10.0,
playback_message_buffer_size=10
)
def test_benchmark(self):
self.run_benchmark()
```
Revise the existing or insert your code in the template based on your graph to be measured.
Follow these steps to ensure that everything in the template is configured correctly:
1. Insert your custom graph (e.g., composable nodes) in the `launch_setup` method.
2. Revise `remappings` in the data loader node to connect rosbag topics to either your preprocessor graph or a playback node.
3. \[Optional\] Insert your preprocessor graph in the `launch_setup` method if required.
4. Revise `data_formats` and `remappings` in the playback node to connect to the loaded/preprocessed data and your custom graph.
5. Insert your custom nodes declared in step 1 to the composable node container.
6. Revise/add benchmark configurations under `ROS2BenchmarkConfig` declaration based on your custom graph.
The full benchmark configuration options can be found [here](ros2_benchmark/ros2_benchmark/default_ros2_benchmark_config.yaml) in the default `ros2_benchmark` configuration file.
## Profiling
When seeking to optimize performance, profiling is often used to gain deep insight into the call stack, and where processing time is spent in functions. [ros2_tracing](https://github.com/ros2/ros2_tracing) provides a tracing instrumentation to better understand performance on a CPU, but lacks information on GPU acceleration.
[Nsight Systems](https://developer.nvidia.com/nsight-systems) provides tracing instrumentation for CPU, GPU, and other SOC (system-on-chip) hardware accelerators for both `aarch64` and `x86_64` platforms, and is freely available for download. We use this tooling to profile our graphs of computation in ROS, to identify areas of improvement for compute optimization, and improvement of synchronization between heterogenous computing hardware. These tools allow for comparison of before and after to inspect profile differences with the benchmark tooling.
## Live Benchmark Mode
Besides benchmarking a graph with data loaded from rosbags, `ros2_benchmark` also supports a live benchmark mode that enables measuring performance outcome of a graph with its data source (e.g., a grph consists of a camera node). A [Realsense benchmark script](scripts/realsense2_node.py) is provided as an example to showcase the use of the live benchmark mode.
## Updates
| Date | Changes |
| ---------- | ----------------------------------- |
| 2024-05-30 | Include r2b Dataset 2024 |
| 2023-11-16 | Add support for live benchmark mode |
| 2023-04-05 | Initial release |