https://github.com/observedobserver/pygwalker-shiny
run pygwalker with shiny
https://github.com/observedobserver/pygwalker-shiny
Last synced: 12 months ago
JSON representation
run pygwalker with shiny
- Host: GitHub
- URL: https://github.com/observedobserver/pygwalker-shiny
- Owner: ObservedObserver
- License: mit
- Created: 2023-10-22T22:42:10.000Z (over 2 years ago)
- Default Branch: main
- Last Pushed: 2023-10-22T22:42:11.000Z (over 2 years ago)
- Last Synced: 2025-04-07T18:16:04.656Z (about 1 year ago)
- Language: Python
- Size: 4.88 KB
- Stars: 3
- Watchers: 2
- Forks: 2
- Open Issues: 2
-
Metadata Files:
- Readme: README.md
- License: LICENSE
Awesome Lists containing this project
README
## How to Integrate PyGWalker with Shiny-Python
`Shiny-Python` is a great framework to build interactive web applications using Python, and combining it with `pygwalker` opens up new avenues for creating data-driven interactive web applications. In this tutorial, we'll walk you through the process of integrating `pygwalker` with `Shiny-Python`.
### Prerequisites:
1. Ensure you have both `shiny` and `pygwalker` libraries installed. You can do this using pip:
```bash
pip install shiny pygwalker
```
### Step-by-Step Guide:
#### 1. Import Necessary Libraries
Start by importing the required modules:
```py
from shiny import App, ui
import pygwalker as pyg
from datasets import load_dataset
```
#### 2. Load the Dataset
For this tutorial, we're leveraging the NYC-Airbnb dataset, but you can replace it with any dataset you prefer:
```py
dataset = load_dataset("gradio/NYC-Airbnb-Open-Data", split="train")
df = dataset.to_pandas()
```
#### 3. Design the Shiny User Interface
Define the user interface (UI) of the Shiny application using `ui` components:
```py
app_ui = ui.page_fluid(
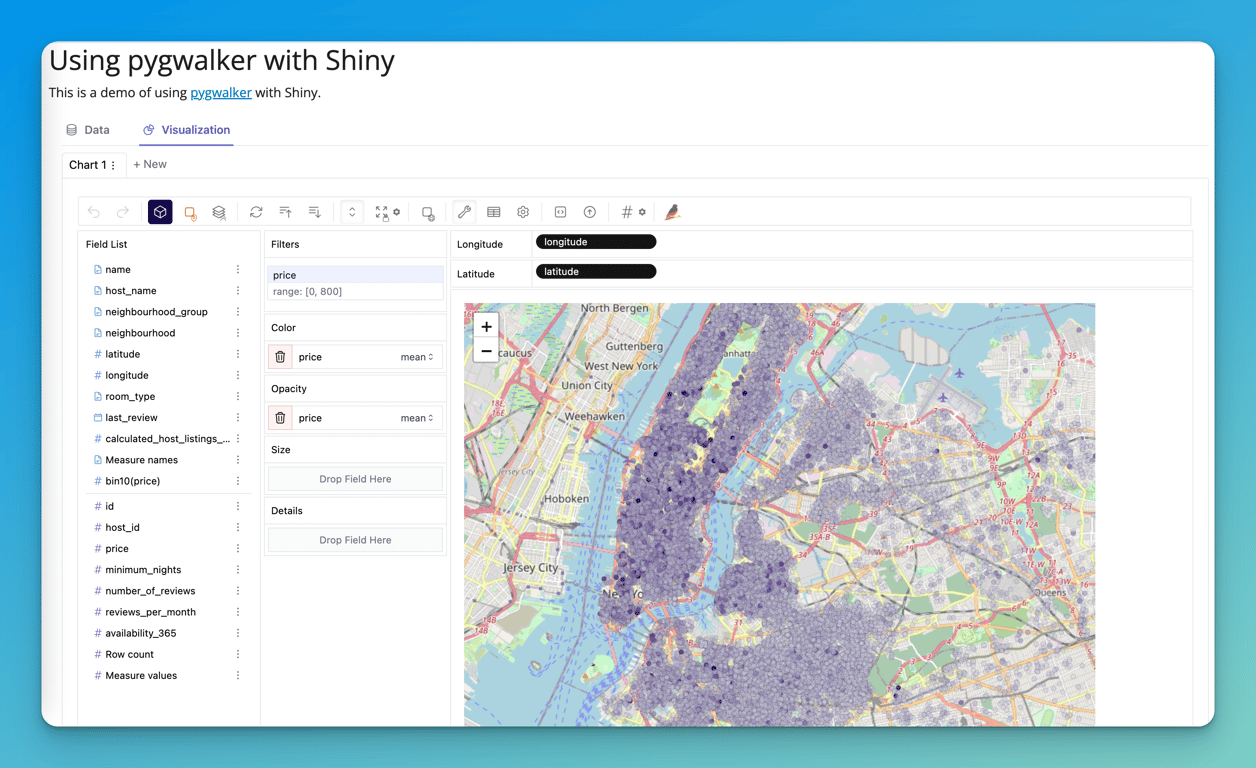
ui.h1("Using pygwalker with Shiny"),
ui.markdown("This is a demo of using [pygwalker](https://github.com/Kanaries/pygwalker) with Shiny."),
ui.HTML(pyg.walk(df, spec="./viz-config.json", return_html=True, debug=False)),
)
```
Here's a quick breakdown of the UI components:
- `ui.h1()`: Adds a header to the Shiny app.
- `ui.markdown()`: Allows you to include markdown-formatted text for descriptions or additional information.
- `ui.HTML()`: This is where `pygwalker` comes into play. The `pyg.walk()` function transforms the dataset into an interactive visualization, which is then rendered in the Shiny app through this HTML component.
#### 4. Define the Server Function
Though in this example, the server function is empty, it's where any reactive behavior would be defined. As the app grows more complex, you might find yourself populating this section with more interactive logic.
```py
def server(input, output, session):
...
```
#### 5. Instantiate and Run the App
Finally, create the Shiny app instance and then run it:
```py
app = App(app_ui, server)
```
If you want to immediately launch the app, you can add the line:
```py
app.run()
```
or
```bash
shiny run --reload
```

### Conclusion
By integrating `pygwalker` with `Shiny-Python`, you can harness the power of both tools to build impressive and interactive data visualization web apps. This not only provides a rich user experience but also allows a broader audience to engage with your data insights. Get started and unleash the potential of your datasets!