https://github.com/oecd-cyc/oecd-simple-charts
A lightweight charting tool
https://github.com/oecd-cyc/oecd-simple-charts
chart visualization
Last synced: 2 months ago
JSON representation
A lightweight charting tool
- Host: GitHub
- URL: https://github.com/oecd-cyc/oecd-simple-charts
- Owner: oecd-cyc
- License: other
- Created: 2018-02-18T14:55:24.000Z (over 7 years ago)
- Default Branch: master
- Last Pushed: 2022-12-09T04:52:50.000Z (over 2 years ago)
- Last Synced: 2025-03-18T10:51:35.875Z (3 months ago)
- Topics: chart, visualization
- Language: JavaScript
- Homepage: https://oecd-cyc.github.io/oecd-simple-charts
- Size: 2.54 MB
- Stars: 18
- Watchers: 6
- Forks: 0
- Open Issues: 21
-
Metadata Files:
- Readme: README.md
- Changelog: CHANGELOG.md
- License: LICENSE
Awesome Lists containing this project
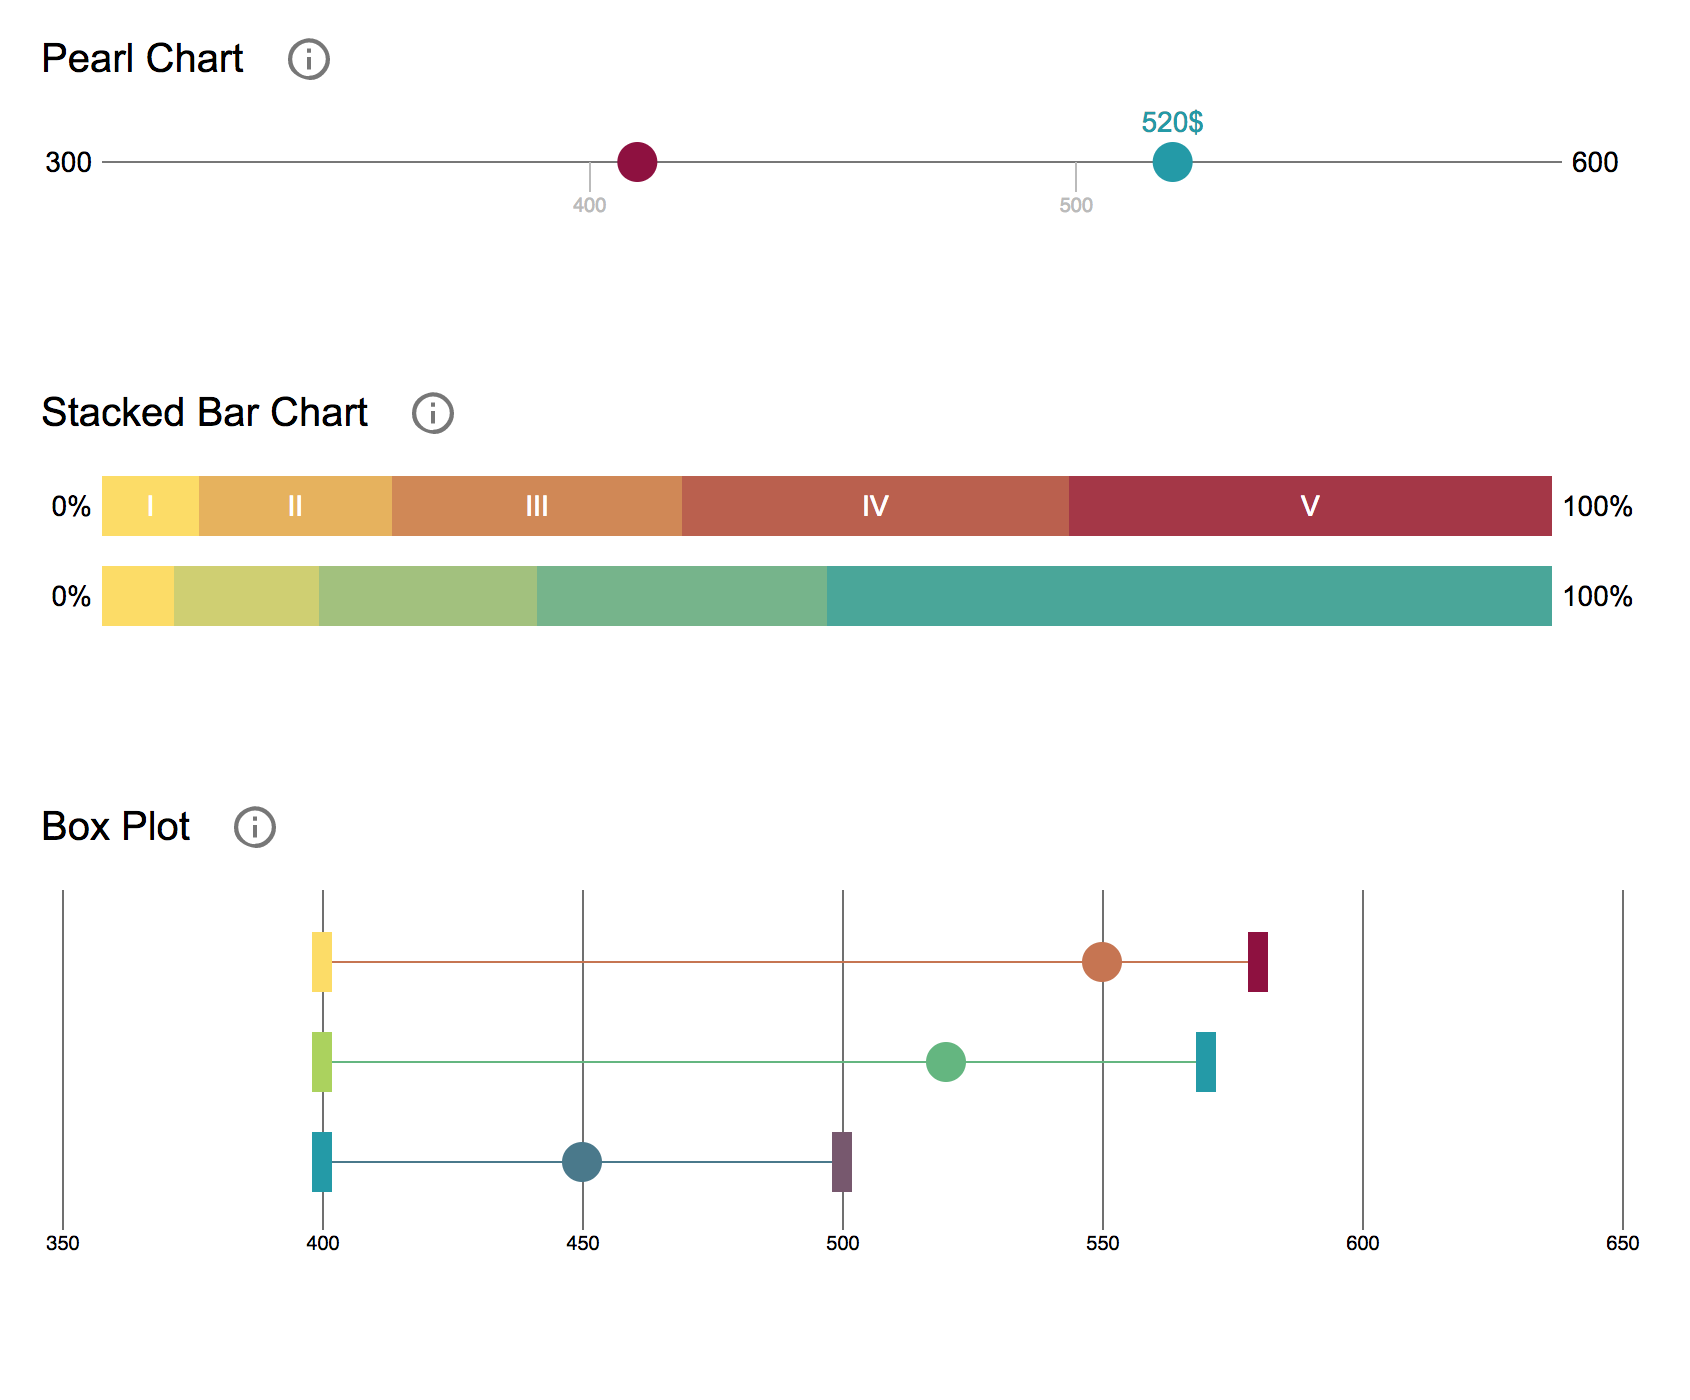
- awesome-d3 - oecd-simple-charts - Simple charting library [box plot, stacked bar, pearl chart] (Charts)
- awesome-d3 - oecd-simple-charts - Simple charting library [box plot, stacked bar, pearl chart] (Charts)
- awesome-d3 - oecd-simple-charts - Simple charting library [box plot, stacked bar, pearl chart] (Charts)
README
        # OECD Simple Charts

A lightweight chartingtool. Visit the [docs](https://oecd-cyc.github.io/oecd-simple-charts) or checkout the [code](https://github.com/oecd-cyc/oecd-simple-charts).


## Usage

To get started, you can either install the library using npm

```

npm install oecd-simple-charts

```

or embed the `bundle.min.js` and `bundle.min.css` files, either downloading them from the [repository](https://github.com/oecd-cyc/oecd-simple-charts) or directly embedding them from a CDN service like [unpkg](https://unpkg.com/oecd-simple-charts/build/oecd-simple-charts.min.js) or [jsDelivr](https://unpkg.com/oecd-simple-charts/build/oecd-simple-charts.min.js).

```html

```

In order to create a chart you need to add a container DOM node. Then you can start with the configuration of the chart. You can set a title, change the size and color of the elements and add data points. Each chart has an `update` function, that takes an array of new data and updates the visualization.

## Development

Clone the repository, install the dependencies, builds the application and starts a webserver with hot loading on [localhost:3000](http://localhost:3000/):

```sh

$ git clone https://github.com/oecd-cyc/oecd-simple-charts.git

$ cd oecd-simple-charts

$ npm install

$ npm start

```

## Build

Builds a minified version of the library in the `build/` folder.

```sh

$ npm run build

```

## Testing

Run the functional test-suite located in `test/`:

```sh

$ npm test

```

To run the visual-regression tests, you will first need a running webserver on port 3000 (see [Development](#development)). Then you can start the tests running:

```sh

$ npm run test:visual

```

If the test fails, but you want to keep your changes run:

```sh

$ npm run test:visual:reference

```

This will save new screenshots in the `screenshots/` folder and these will be used as reference to be tested against the next time you run the tests.

## Update documentation

In order to generate the docs, run:

```sh

$ npm run docs

```