https://github.com/oksktank/react-native-pure-chart
react-native chart library that not using svg or ART but only using react native pure components.
https://github.com/oksktank/react-native-pure-chart
barchart linechart react-native react-native-charts without-drawing-library-integration
Last synced: 5 months ago
JSON representation
react-native chart library that not using svg or ART but only using react native pure components.
- Host: GitHub
- URL: https://github.com/oksktank/react-native-pure-chart
- Owner: oksktank
- License: mit
- Created: 2017-09-20T10:29:46.000Z (about 8 years ago)
- Default Branch: master
- Last Pushed: 2022-05-11T07:35:11.000Z (over 3 years ago)
- Last Synced: 2024-11-08T00:10:42.080Z (11 months ago)
- Topics: barchart, linechart, react-native, react-native-charts, without-drawing-library-integration
- Language: JavaScript
- Homepage:
- Size: 13.9 MB
- Stars: 288
- Watchers: 11
- Forks: 132
- Open Issues: 77
-
Metadata Files:
- Readme: README.md
- License: LICENSE
Awesome Lists containing this project
- awesome-list - react-native-pure-chart - native chart library that not using svg or ART but only using react native pure components. | oksktank | 268 | (JavaScript)
README
# React Native Pure Chart
[](https://www.npmjs.org/package/react-native-pure-chart)
[](https://www.npmjs.org/package/react-native-pure-chart)
[](https://raw.githubusercontent.com/somonus/react-native-pure-chart/master/LICENSE.md)
Pure react native chart library that not using svg or ART but only using `react-native` components.
(You don't have to import drawing library with `react-native link` or add `ART` to your project!)
## Demo
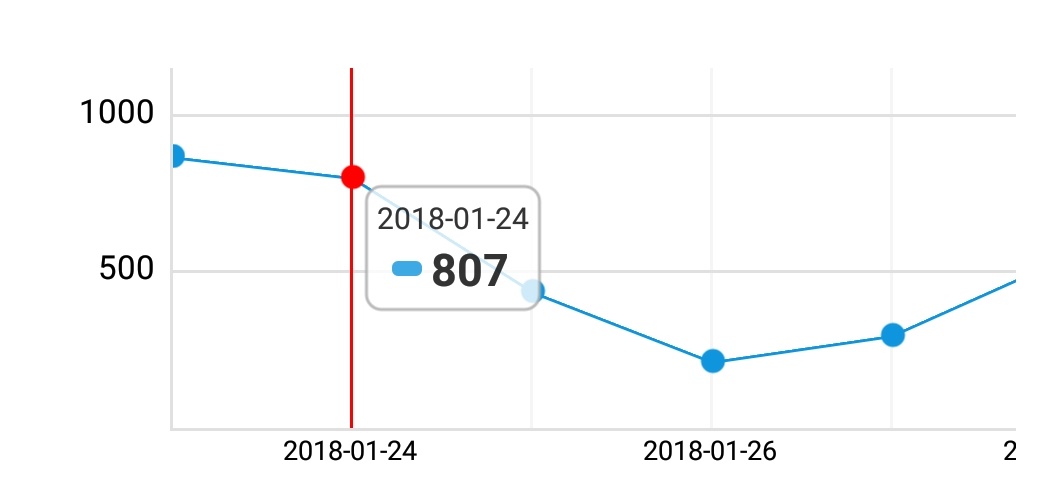
- **LineChart**
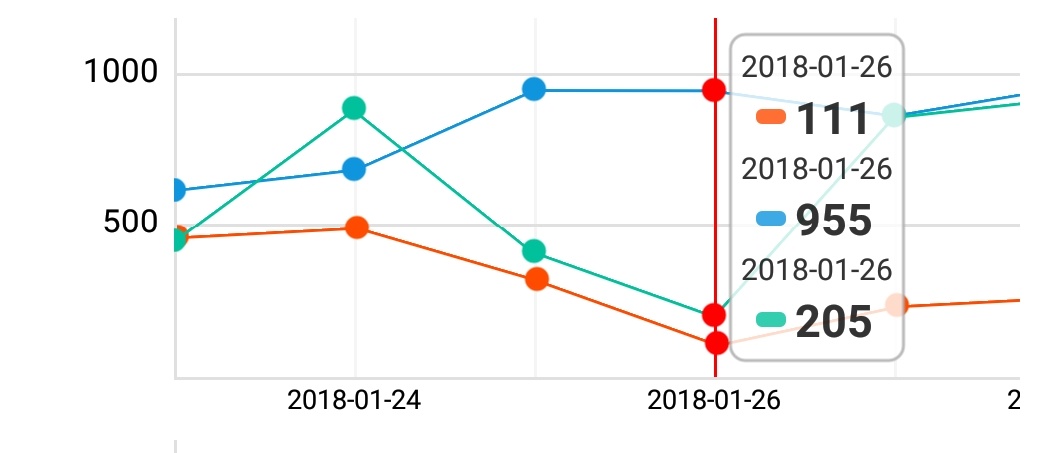
- **LineChart (Multi series)**
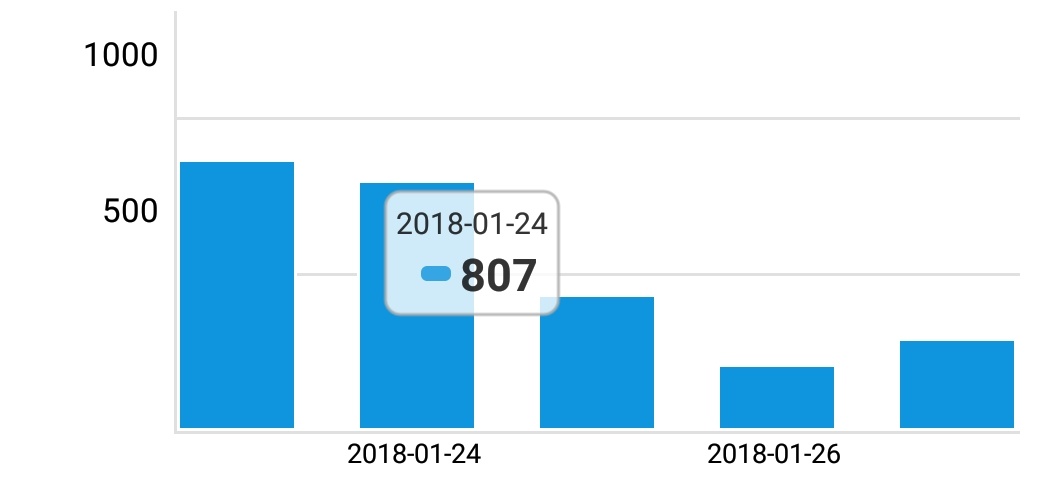
- **BarChart**
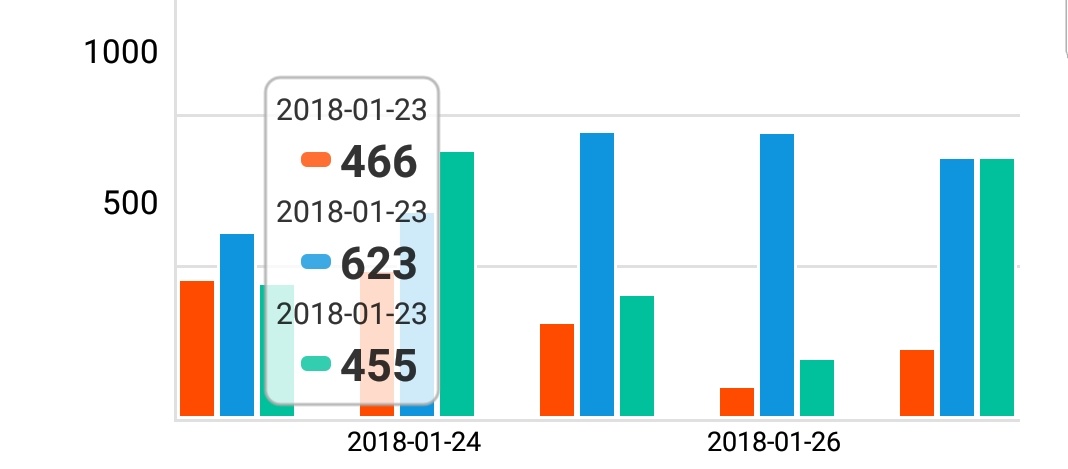
- **BarChart (Multi series)**
- **PieChart (Beta)**

## Installation
```bash
yarn add react-native-pure-chart
```
Alternatively with npm:
```bash
npm install react-native-pure-chart --save
```
## Required
```js
import PureChart from 'react-native-pure-chart';
```
## Usage
#### Single Series: Simple
```js
render(
...
let sampleData = [30, 200, 170, 250, 10]
...
);
```
#### Single Series: with labels
```js
render(
...
let sampleData = [
{x: '2018-01-01', y: 30},
{x: '2018-01-02', y: 200},
{x: '2018-01-03', y: 170},
{x: '2018-01-04', y: 250},
{x: '2018-01-05', y: 10}
]
...
);
```
#### Multi Series: Simple
```js
render(
...
let sampleData = [
[
{seriesName: 'series1', data: [30, 200, 170, 250, 10], color: '#297AB1'},
{seriesName: 'series2', data: [20, 100, 150, 130, 15], color: 'yellow'}
]
]
...
);
```
#### Multi Series: with labels
```js
render(
...
let sampleData = [
{
seriesName: 'series1',
data: [
{x: '2018-02-01', y: 30},
{x: '2018-02-02', y: 200},
{x: '2018-02-03', y: 170},
{x: '2018-02-04', y: 250},
{x: '2018-02-05', y: 10}
],
color: '#297AB1'
},
{
seriesName: 'series2',
data: [
{x: '2018-02-01', y: 20},
{x: '2018-02-02', y: 100},
{x: '2018-02-03', y: 140},
{x: '2018-02-04', y: 550},
{x: '2018-02-05', y: 40}
],
color: 'yellow'
}
]
...
);
```
#### Pie chart
```js
render(
...
let sampleData = [
{
value: 50,
label: 'Marketing',
color: 'red',
}, {
value: 40,
label: 'Sales',
color: 'blue'
}, {
value: 25,
label: 'Support',
color: 'green'
}
]
...
);
```
### Props
##### `type`: string
type of chart. ['line' | 'bar' | 'pie'] is now available
##### `height`: number
height of chart
##### `data`: array
data for chart
```js
var data = [30, 200, 170, 250, 10]
var dataWithLabel = [
{x: '2017-10-01', y: 30},
{x: '2017-10-02', y: 200},
{x: '2017-10-03', y: 170} ...
]
```
multi series data for chart
```js
var data = [
{seriesName: 'series1', data: [30, 200, 170, 250, 10], color: '#297AB1'},
{seriesName: 'series2', data: [40, 250, 110, 290, 14], color: 'blue'}
]
var dataWithLabel = [
{
seriesName: 'series1',
data:[
{x: '2017-10-01', y: 30},
{x: '2017-10-02', y: 200},
{x: '2017-10-03', y: 170} ...
],
color: '#297AB1'
},
....
]
```
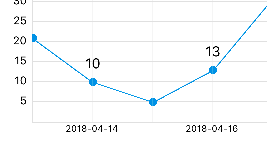
##### `customValueRenderer`: func
add custom value on the point
```js
{
if (index % 2 === 0) return null
return (
{point.y}
)
}}/>
```
##### `numberOfYAxisGuideLine`: number
set number of Y Axis guide line
## Contributing
Contributions are welcome. Any kind of contribution, such as writing a documentation, bug fix, or solving issues are helpful.
The `master` branch of this repository contains the latest stable release of *react-native-pure-chart*. In general, pull requests should be submitted from a separate branch starting from the `develop` branch.
## License
MIT