https://github.com/olgabot/prettyplotlib
Painlessly create beautiful matplotlib plots.
https://github.com/olgabot/prettyplotlib
Last synced: 4 months ago
JSON representation
Painlessly create beautiful matplotlib plots.
- Host: GitHub
- URL: https://github.com/olgabot/prettyplotlib
- Owner: olgabot
- License: mit
- Created: 2013-07-18T14:39:58.000Z (about 13 years ago)
- Default Branch: master
- Last Pushed: 2019-01-31T16:40:48.000Z (over 7 years ago)
- Last Synced: 2025-12-16T01:48:24.224Z (7 months ago)
- Language: Python
- Homepage: olgabot.github.io/prettyplotlib
- Size: 27.4 MB
- Stars: 1,707
- Watchers: 82
- Forks: 144
- Open Issues: 11
-
Metadata Files:
- Readme: README
- Changelog: CHANGES.txt
- License: LICENSE.txt
Awesome Lists containing this project
- awesome-python-data-science - prettyplotlib - Painlessly create beautiful matplotlib plots. (Visualization / General Purposes)
- fintech-awesome-libraries - prettyplotlib - Painlessly create beautiful matplotlib plots. (Data Visualization / General Purposes)
- awesome-python-data-science - prettyplotlib - Painlessly create beautiful matplotlib plots. (Visualization / General Purposes)
- awesome-python-again -
README
# Announcement
Thank you to everyone who has used `prettyplotlib` and made it what it is today! Unfortunately, I no longer have the bandwidth to maintain prettyplotlib. I recommend using [`seaborn`](https://github.com/mwaskom/seaborn). Using `seaborn`, to get the `prettyplotlib` style, do:
import seaborn as sns
sns.set(style='ticks', palette='Set2')
And to remove "chartjunk", do:
sns.despine()
If you have discrete pull requests, I will accept them, but I personally will no longer fix bugs.
If you are a biological scientist looking for ways to analyze your big-ish (20+ samples) data, check out my main project, [`flotilla`](https://github.com/YeoLab/flotilla).
[](https://travis-ci.org/olgabot/prettyplotlib)
prettyplotlib
=============
Python matplotlib-enhancer library which painlessly creates beautiful default `matplotlib`
plots. Inspired by [Edward Tufte](http://www.edwardtufte.com/tufte/)'s work on information design and [Cynthia Brewer](http://www.personal.psu.edu/cab38/)'s work on [color perception](http://colorbrewer2.org/).
I truly believe that scientific progress is impeded when improper data visualizations are used. I spent a lot of time tweaking my figures to make them more understandable, and realized the scientific world could be a better place if the default parameters for plotting libraries followed recent advances in information design research. And thus `prettyplotlib` was born.
Requirements:
* [`matplotlib`](http://matplotlib.org/). Can be installed via `pip install matplotlib` or `easy_install matplotlib`
* [`brewer2mpl`](https://github.com/jiffyclub/brewer2mpl). Can be installed via `pip install brewer2mpl` or `easy_install brewer2mpl`
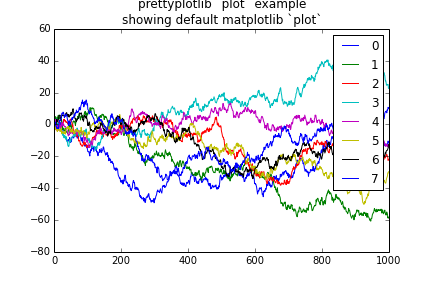
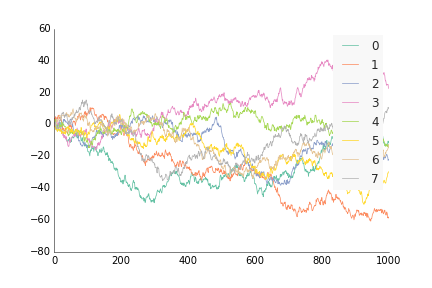
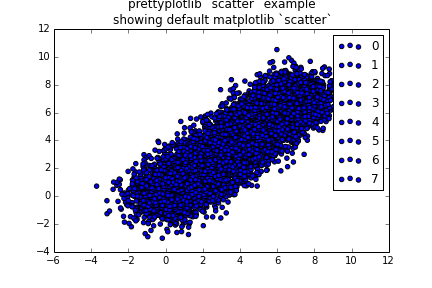
## Comparison to `matplotlib`
matplotlib default plot
prettyplotlib default plot
matplotlib default scatter
prettyplotlib default scatter

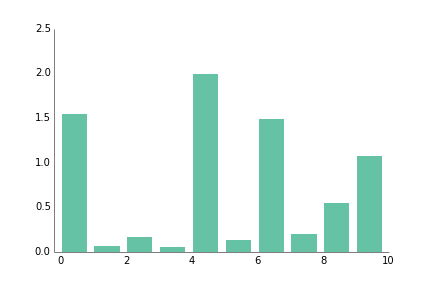
matplotlib default bar
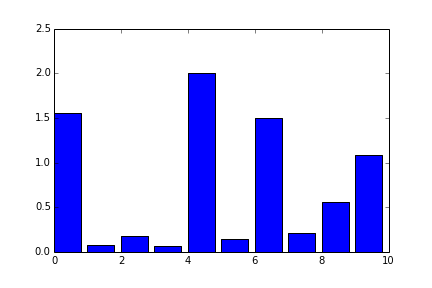
prettyplotlib default bar
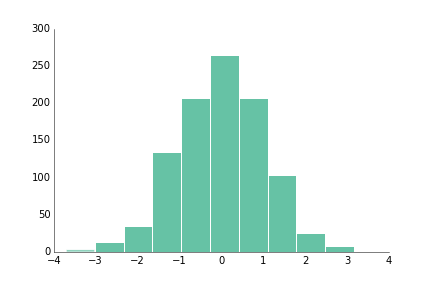
matplotlib default hist

prettyplotlib default hist
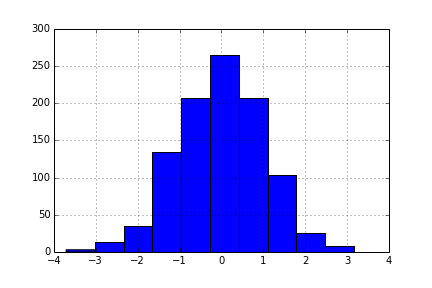
matplotlib default hist
with grid
prettyplotlib default hist
with grid

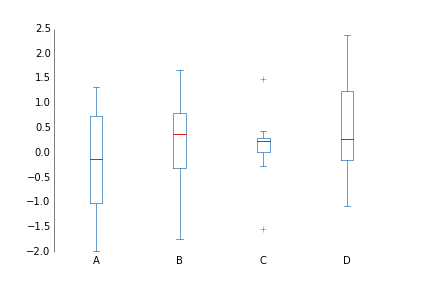
matplotlib default boxplot
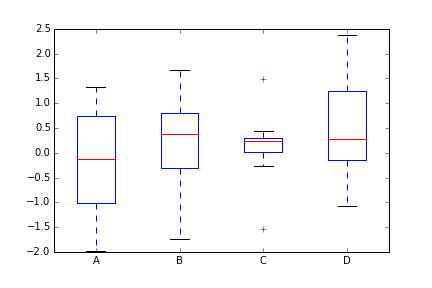
prettyplotlib default boxplot
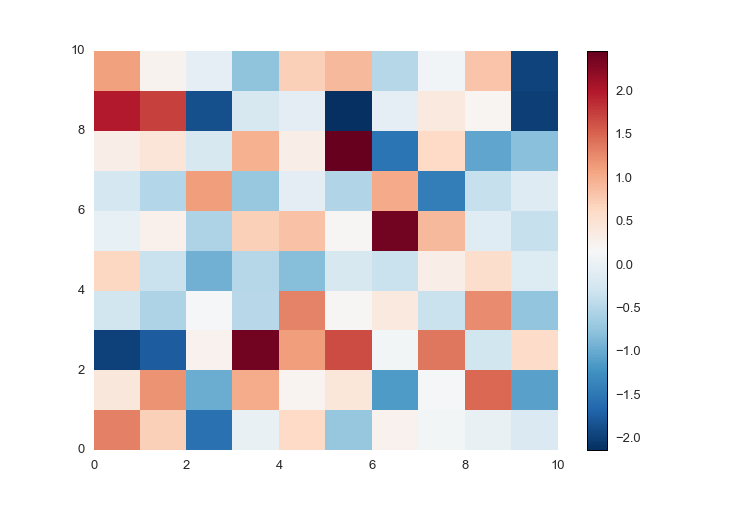
matplotlib default pcolormesh
positive and negative data

prettyplotlib default pcolormesh
positive and negative data
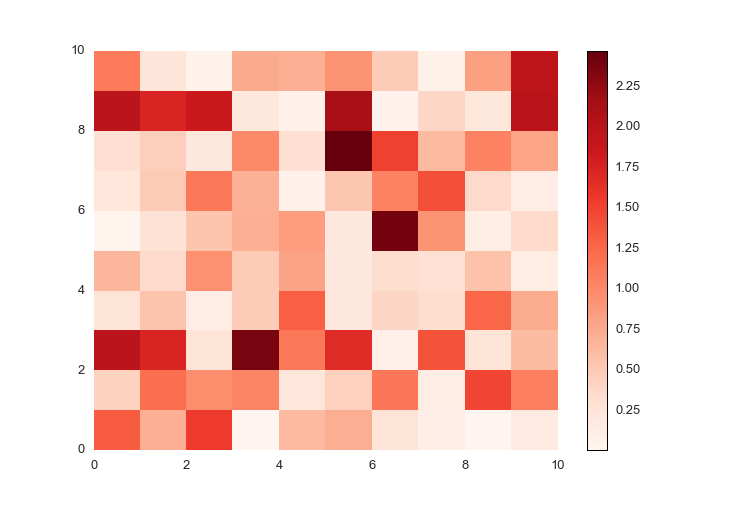
matplotlib default pcolormesh
positive data only

prettyplotlib default pcolormesh
positive data only
matplotlib pcolormesh
negative-valued data with labels
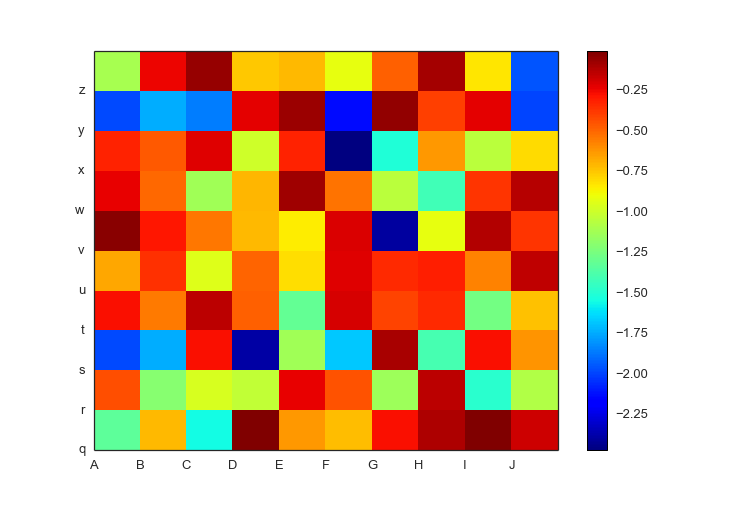
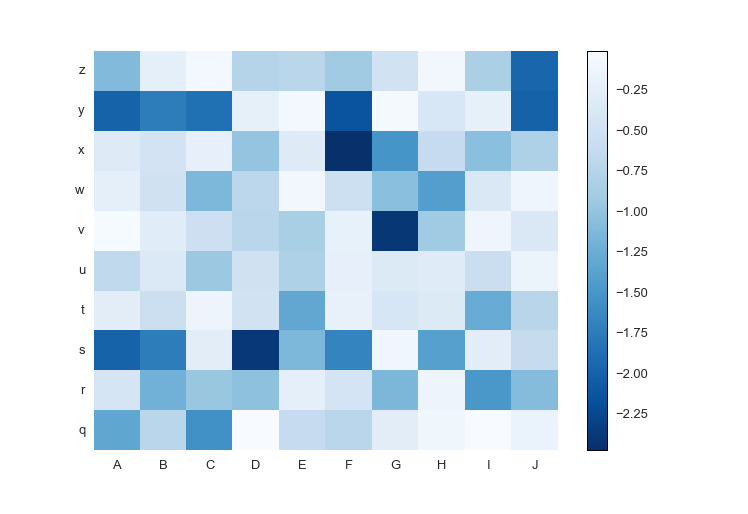
prettyplotlib pcolormesh
negative-valued data with labels
### Quotes
_"Dis ain't no **ugly**plotlib"_ - Anonymous