https://github.com/onc/bluenoiseplots
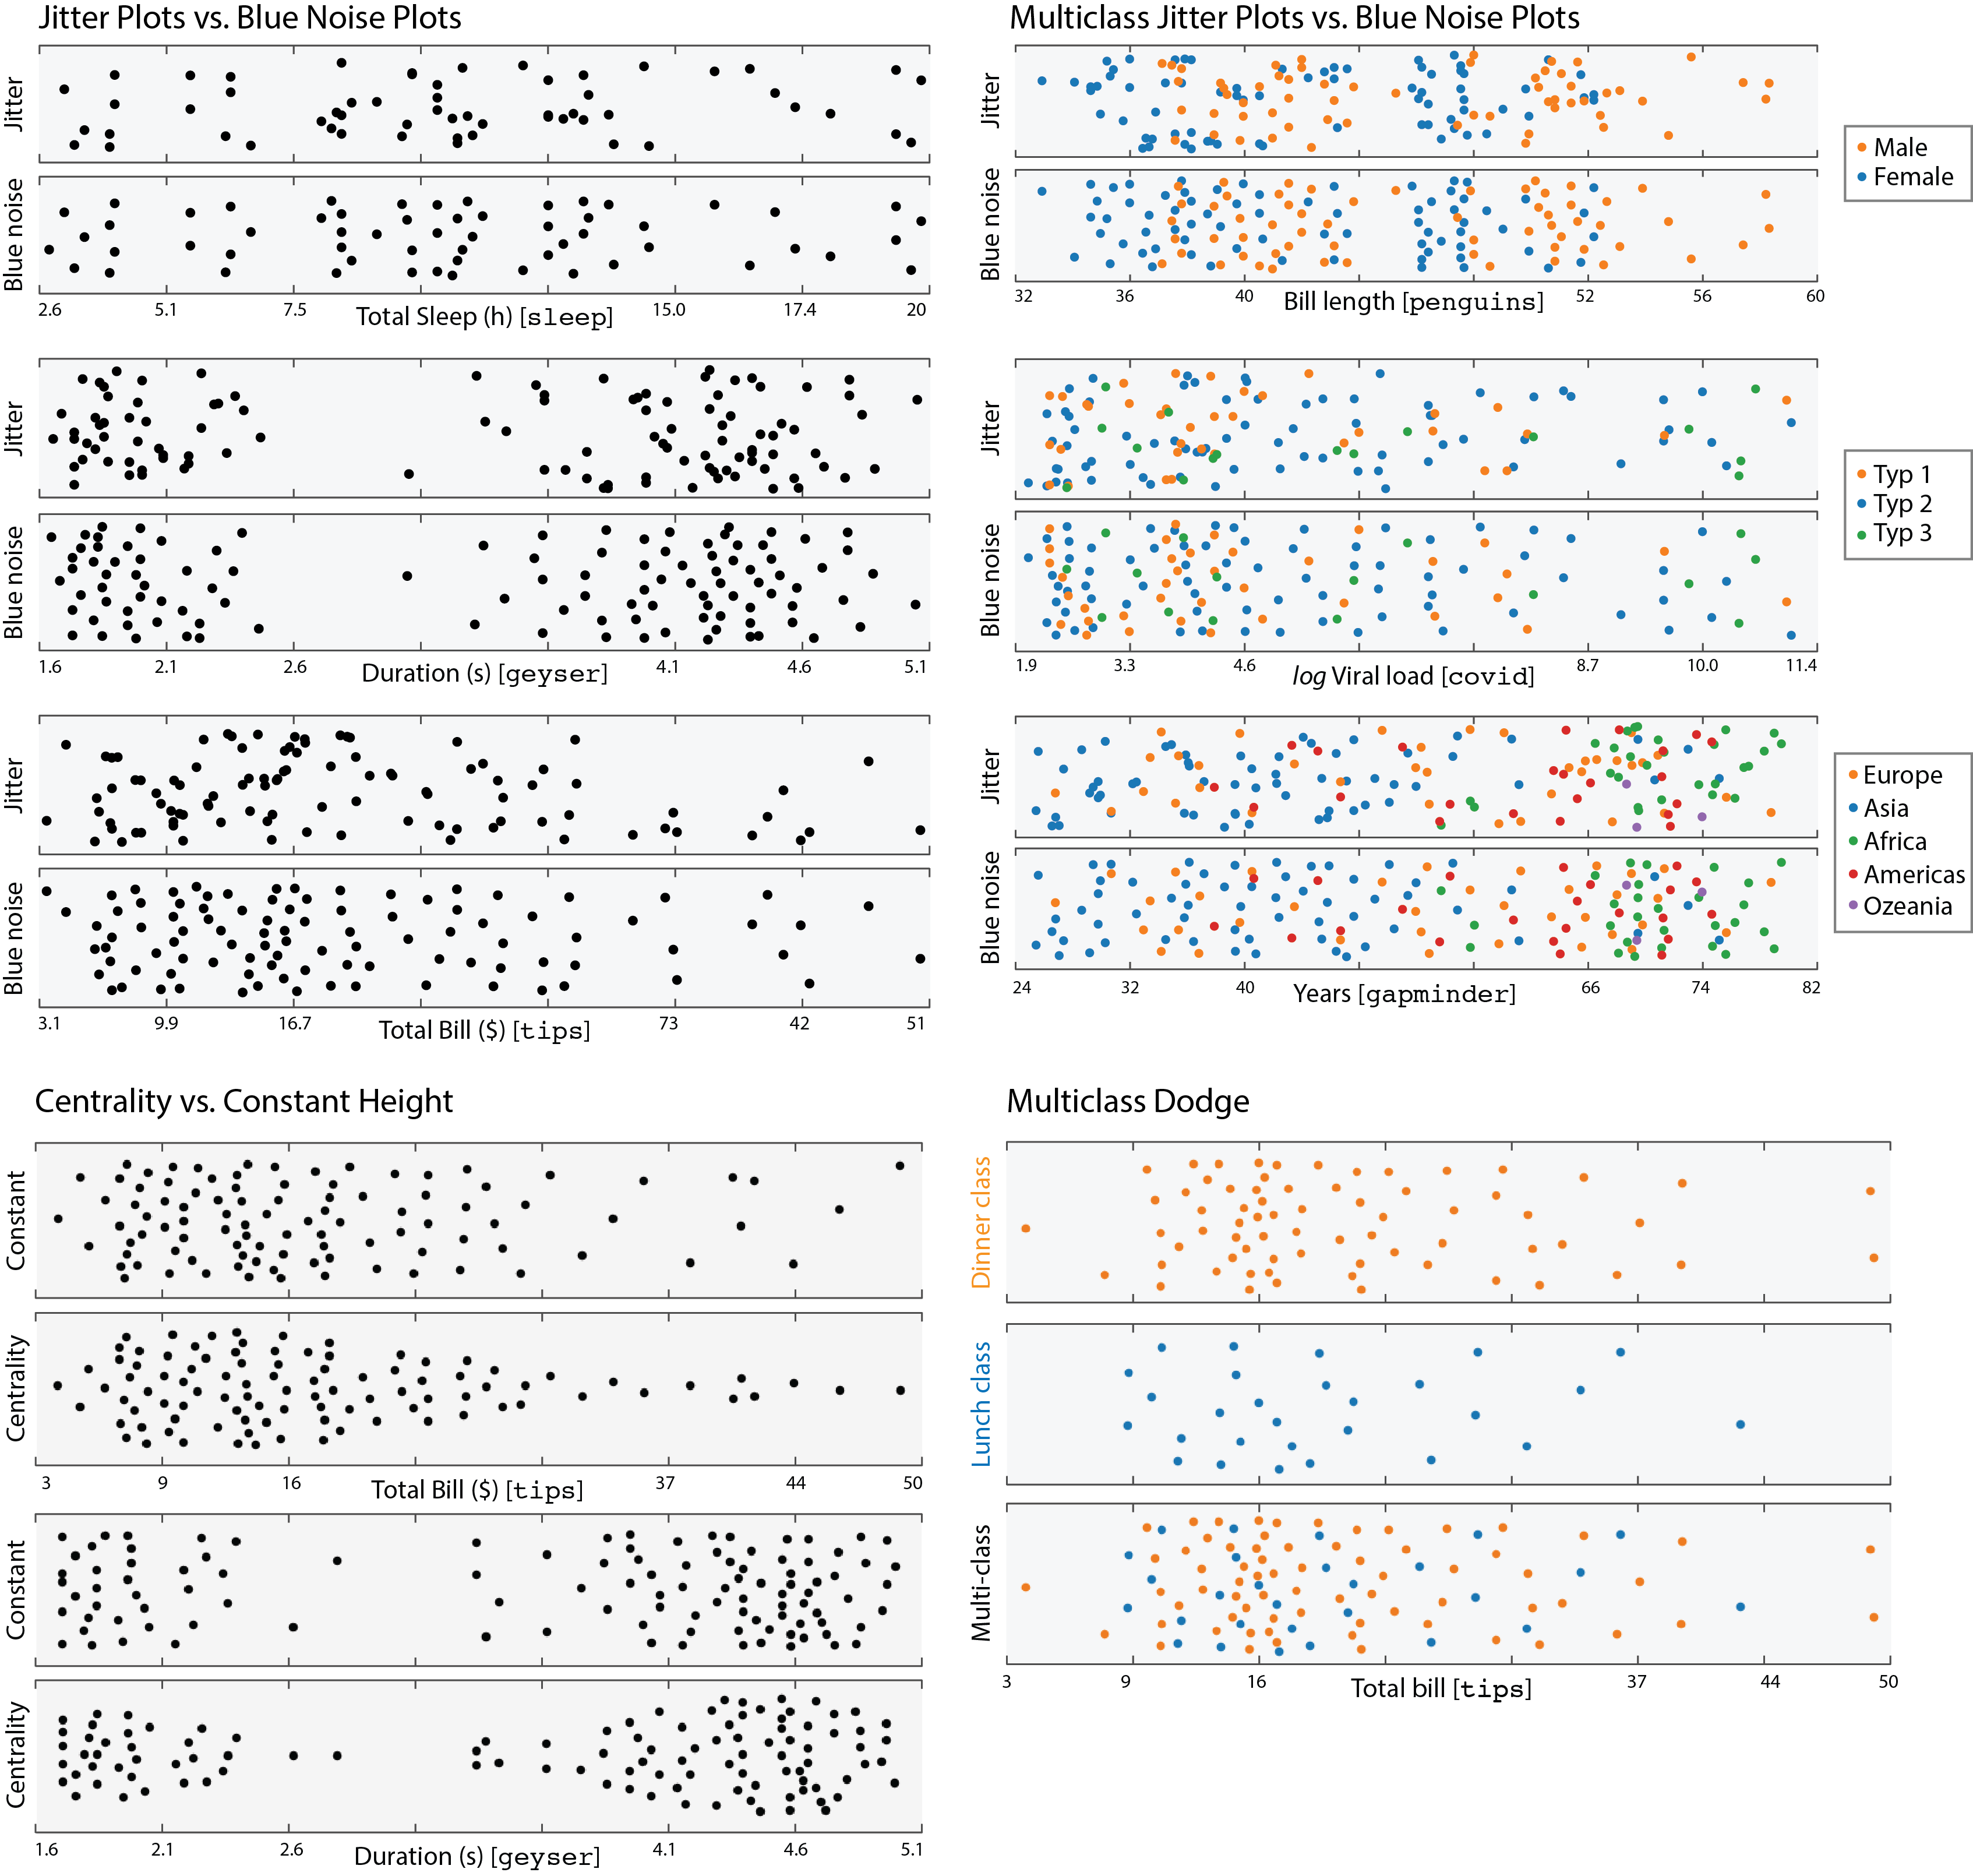
Python implementation of Blue Noise Plots, a novel replacement for jitter plots, published at Eurographics 2021.
https://github.com/onc/bluenoiseplots
infovis jitterplot stripplots
Last synced: about 2 months ago
JSON representation
Python implementation of Blue Noise Plots, a novel replacement for jitter plots, published at Eurographics 2021.
- Host: GitHub
- URL: https://github.com/onc/bluenoiseplots
- Owner: onc
- License: mit
- Created: 2021-01-12T16:55:31.000Z (over 4 years ago)
- Default Branch: main
- Last Pushed: 2023-05-01T07:03:04.000Z (about 2 years ago)
- Last Synced: 2025-03-27T04:22:24.592Z (2 months ago)
- Topics: infovis, jitterplot, stripplots
- Language: Python
- Homepage: https://www.uni-ulm.de/in/mi/mi-forschung/viscom/publikationen?category=publication&publication_id=195
- Size: 703 KB
- Stars: 3
- Watchers: 1
- Forks: 2
- Open Issues: 10
-
Metadata Files:
- Readme: README.md
- License: LICENSE
Awesome Lists containing this project
README
# Blue Noise Plots
Python implementation of *Blue Noise Plots*, a novel replacement for jitter plots, published at Eurographics 2021.
[C. van Onzenoodt](https://www.uni-ulm.de/en/in/mi/institute/staff/christian-van-onzenoodt/), [G. Singh](https://people.mpi-inf.mpg.de/~gsingh/), [T. Ropinski](https://www.uni-ulm.de/in/mi/institut/mitarbeiter/timo-ropinski/), and [T. Ritschel](http://www.homepages.ucl.ac.uk/~ucactri/)

[Paper Pre-Print](https://arxiv.org/abs/2102.04072)
[Project Page](https://www.uni-ulm.de/in/mi/mi-forschung/viscom/publikationen?category=publication&publication_id=195)
## Prerequisites
This implementation uses tensorflow to enable hardware acceleration on supported platforms (Linux and Windows). Therefore, *Blue Noise Plots* are currently limited by prerequisites of tensorflow:
* Python 3.5–3.8
* Ubuntu 16.04 or later
* Windows 7 or later
* macOS 10.12.6 (Sierra) or later (no GPU support)
### Install dependencies
```
cd BlueNoisePlots
pip install -r requirements.txt
```
## Usage
```python
import pandas as pd
from blue_noise_plot import blue_noise
# Load data
mpg_filename = 'csv_data/auto-mpg.data'
column_names = ['mpg', 'cylinders', 'displacement', 'horsepower', 'weight',
'acceleration', 'year', 'origin', 'name']
mpg = pd.read_csv(mpg_filename, delim_whitespace=True, names=column_names)
subset = mpg[mpg['cylinders'].isin([4, 6, 8])]
# Blue noise plot of `subset`, using our automatic width computation
points = blue_noise(x='mpg', data=subset, orient='h')
print('Num Classes: ', len(points)) # Num Classes: 1
print('Num Points: ', len(points[0])) # Num Points: 391
points = blue_noise(x='mpg', hue='cylinders', data=subset, orient='h')
print('Num Classes: ', len(points)) # Num Classes: 3
print('Num Points: ', len(points[0])) # Num Points: 204
print('Num Points: ', len(points[1])) # Num Points: 103
print('Num Points: ', len(points[2])) # Num Points: 84
points = blue_noise(x='mpg', hue='cylinders', data=subset, orient='h')
# Blue noise plot of `subset`, using predefined width.
points = blue_noise(x='mpg', hue='cylinders', data=subset, orient='h', plot_width=0.3)
# Render png of the distribution
blue_noise(x='mpg', hue='cylinders', data=subset, orient='h', size=20,
filename='mpg-blue_noise_plot.png')
```
## Advanced Usage
```python
# Centralized Blue Noise Plot (see Examples below)
blue_noise(x='mpg', hue='cylinders', data=subset, centralized=True,
orient='h', size=20, filename='mpg-blue_noise_plot.png')
# Dodged Blue Noise Plot (see Examples below)
blue_noise(x='mpg', hue='cylinders', data=subset, dodge=True,
orient='h', size=20, filename='mpg-blue_noise_plot.png')
```
## Examples

To generate the examples, run the following:
```python
cd examples
pip install -r requirements.txt
./example_plots.py
```