https://github.com/ovinc/gpxo
Load, analyze and plot GPS data from GPX files with numpy/pandas
https://github.com/ovinc/gpxo
gps gpx numpy pandas python python3
Last synced: 10 months ago
JSON representation
Load, analyze and plot GPS data from GPX files with numpy/pandas
- Host: GitHub
- URL: https://github.com/ovinc/gpxo
- Owner: ovinc
- License: bsd-3-clause
- Created: 2021-01-12T11:24:14.000Z (about 5 years ago)
- Default Branch: master
- Last Pushed: 2025-01-19T17:21:54.000Z (about 1 year ago)
- Last Synced: 2025-03-28T11:11:38.258Z (11 months ago)
- Topics: gps, gpx, numpy, pandas, python, python3
- Language: Jupyter Notebook
- Homepage:
- Size: 7.32 MB
- Stars: 11
- Watchers: 1
- Forks: 1
- Open Issues: 0
-
Metadata Files:
- Readme: README.md
- License: LICENSE
Awesome Lists containing this project
README
About
=====
Load GPS data from GPX files into Python as a numpy arrays and *pandas* DataFrames. Initial parsing done using the *gpxpy* package. Trajectory plotting on a map available using *mplleaflet* (optional).
Quick Start
===========
Install
-------
```bash
pip install gpxo
```
Load Track
----------
```python
import gpxo
track = gpxo.Track('ExampleTrack.gpx')
```
(it is possible to indicate which track or segment to consider during instantiation, by default it is the first one).
`track.data` is a *pandas* DataFrame containing time, position, elevation etc.; usual *pandas* methods can be used to analyze, manipulate and plot data. Individual columns are also available as numpy arrays as attributes of the class (see below).
Detailed Contents
=================
Track class
-----------
Load, inspect and plot GPX data using the `Track` class, with the following methods and attributes.
### Methods
- `smooth()`: smooth position and elevation data (see `gpxo.smooth()` below),
- `plot()`: plot trajectory data using a combination of shortnames (see shortnames below); also takes `matplotlib.pyplot.plot()` arguments/kwargs,
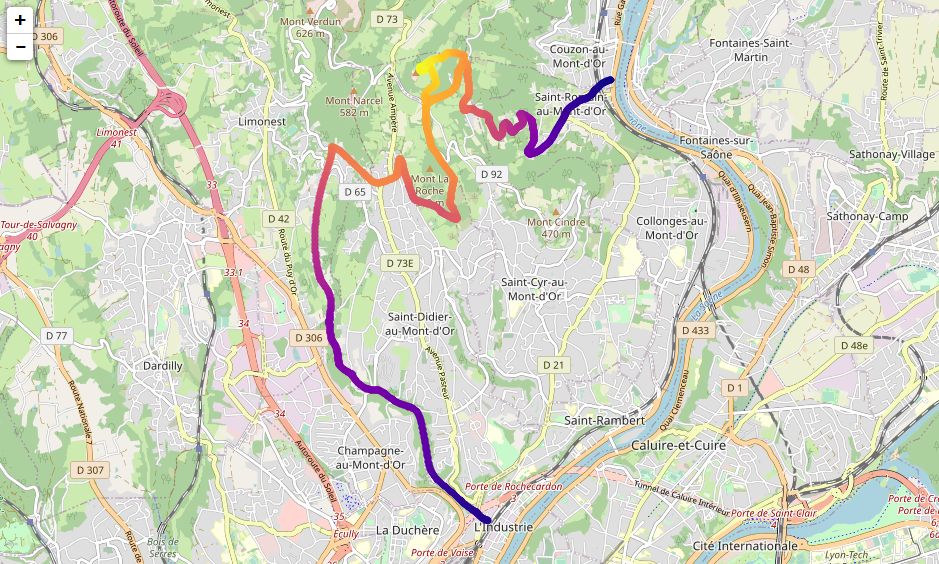
- `map()`: plot trajectory on a map, using `mplleaflet.show()`,
- `closest_to()`: find index of point in trajectory closest to a (lat, long) point.
### Basic Attributes
(some may not be available depending on actual data present in the GPX file)
- `latitude` (numpy array): latitude in °,
- `longitude` (numpy array): longitude in °,
- `elevation` (numpy array): elevation in meters,
- `time` (numpy array): local time expressed as a datetime.datetime.
### Property attributes
(Read-only, and calculated/updated from basic attributes; some may not be available depending on actual data present in the GPX file)
- `seconds` (numpy array): total number of seconds since beginning of track,
- `distance` (numpy array): total distance (km) since beginning of track,
- `velocity` (numpy array): instantaneous velocity (km/h),
- `compass` (numpy array): instantaneous compass bearing (°),
- `data` (pandas DataFrame): all above attributes in a single dataframe.
## Miscellaneous
Outside of the `Track` class, the following standalone function is also available:
- `compass(pt1, pt2)`: compass bearing (°) between pt1 (lat1, long1) and pt2 (lat2, long2),
- `closest_pt(pt, trajectory)`: index of closest pt in trajectory (latitudes, longitudes) to specified pt (lat, long),
- `smooth(x, n, window)`: smooth 1-d array with a moving window of size n and type *window*.
## Short names
| Short name | Corresponding data
| :--------: | :----------------:
| t | time
| s | duration (s)
| d | distance (km)
| v | velocity (km/h)
| z | elevation (m)
| c | compass (°)
Examples
========
See Jupyter Notebook **Examples.ipynb** (https://github.com/ovinc/gpxo/blob/master/Examples.ipynb) for a detailed example using real GPX data.
**Quick example 1**: Plot distance versus time and velocity versus position for a given track:
```python
import gpxo
track = gpxo.Track('ExampleTrack.gpx')
track.plot('td', '--k') # matplotlib styles can be given
track.plot('dv', c='red') # matplotlib kwargs can be passed
track.data # pandas dataframe with all data
```
**Quick example 2**: show the path of a GPX file on a map with color-coding corresponding to elevation (*see Troubleshooting section below in case of error*):
```python
import gpxo
track = gpxo.Track('ExampleTrack.gpx')
track.map(plot='scatter', c=track.elevation, cmap='plasma')
```

Troubleshooting
===============
In case of the following error:
```
'XAxis' object has no attribute '_gridOnMajor
```
when using the `map()` method, try downgrading Matplotlib to version <= 3.3.2 or install a forked version of mplleaflet (see https://github.com/jwass/mplleaflet/issues/75).
Information
===========
Requirements
------------
Python >= 3.6
Dependencies
------------
(automatically installed by pip if necessary)
- *numpy*
- *pandas*
- *matplotlib*
- *importlib-metadata*
- *gpxpy* (https://github.com/tkrajina/gpxpy)
- *vincenty* (https://github.com/maurycyp/vincenty)
Optional:
- *mplleaflet* (https://github.com/jwass/mplleaflet)
Author
------
Olivier Vincent
(ovinc.py@gmail.com)
License
-------
BSD 3-Clause (see *LICENCE* file)