https://github.com/oxylabs/pandas-read-html-tables
A tutorial on parsing HTML tables with pandas
https://github.com/oxylabs/pandas-read-html-tables
github-python pandas python
Last synced: 4 months ago
JSON representation
A tutorial on parsing HTML tables with pandas
- Host: GitHub
- URL: https://github.com/oxylabs/pandas-read-html-tables
- Owner: oxylabs
- Created: 2022-03-14T08:52:22.000Z (over 4 years ago)
- Default Branch: main
- Last Pushed: 2025-06-26T08:23:37.000Z (about 1 year ago)
- Last Synced: 2025-06-26T09:31:05.850Z (about 1 year ago)
- Topics: github-python, pandas, python
- Language: Jupyter Notebook
- Homepage:
- Size: 68.4 KB
- Stars: 1
- Watchers: 0
- Forks: 1
- Open Issues: 0
-
Metadata Files:
- Readme: README.md
Awesome Lists containing this project
README
# How to Read HTML Tables with Pandas
[](https://oxylabs.io/pages/gitoxy?utm_source=877&utm_medium=affiliate&groupid=877&utm_content=pandas-read-html-tables-github&transaction_id=102f49063ab94276ae8f116d224b67)
[ ](https://github.com/topics/pandas) [
 ](https://github.com/topics/python)
[](https://discord.gg/Pds3gBmKMH) [](https://www.youtube.com/@oxylabs)
- [Getting Started](#getting-started)
- [Cleanup and processing of HTML table data](#cleanup-and-processing-of-html-table-data)
- [Invalid and imperfect HTML](#invalid-and-imperfect-html)
- [Extracting HTML tables from files](#extracting-html-tables-from-files)
- [Extracting HTML tables from URLs](#extracting-html-tables-from-urls)
- [Analyzing and visualizing scraped data](#analyzing-and-visualizing-scraped-data)
[Pandas](https://pandas.pydata.org/) is one of the most popular Python libraries for data analysis. This library has many useful functions. One of such functions is pandas `read_html`. It can convert HTML tables into pandas DataFrame efficiently.
This tutorial will show you how useful pandas `read_html` can be, especially when combined with other helpful functions.
For a detailed explanation, see our [blog post](https://oxy.yt/hrFW).
## Getting Started
Pandas can be installed using the `pip` command or `conda` command if you’re using Anaconda.
```shell
pip3 install pandas
conda install pandas
```
You must also install `lxml`, `html5lib`, `BeautifulSoup4`, and `Matplotlib` libraries to facilitate reading & parsing the HTML and plotting the information.
Here are the `pip` commands to install:
```shell
pip3 install lxml
pip3 install html5lib
pip3 install BeautifulSoup4
pip3 install matplotlib
```
If you are using the `conda` prompt, use the following commands:
```shell
conda install lxml
conda install html5lib
conda install BeautifulSoup4
conda install matplotlib
```
In the following line of the code, a variable contains HTML. You should note that we’re using Python’s triple quote conventions to store multiline strings in a variable easily.
```python
html = '''
Sequence
Country
Population
Updated
1
China
1,439,323,776
1-Dec-2020
2
India
1,380,004,385
1-Dec-2020
3
United States
331,002,651
1-Dec-2020
'''
```
The next step is to import pandas and call the pandas `read_html` function:
```python
import pandas as pd
df_list = pd.read_html(html)
```
Note that the pandas `read_html` function returns a list of Pandas `DataFrame` objects. This can be verified by checking the length of the `df_list` variable:
```python
print(len(df_list))
# OUTPUT: 1
```
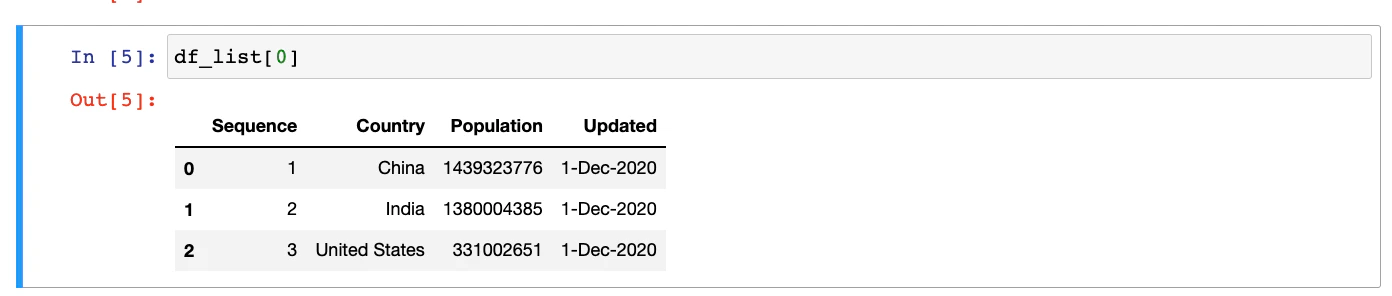
Let’s check the content of the DataFrame by printing it.
```
print(df_list[0])
```
When you run from the terminal, the data from HTML tables will be extracted and displayed as follows:
```shell
$ python3 read_html.py
Sequence Country Population Updated
0 1 China 1439323776 1-Dec-2020
1 2 India 1380004385 1-Dec-2020
2 3 United States 331002651 1-Dec-2020
```
If you’re using Jupyter Notebook, the output of the same command will have a better appearance.
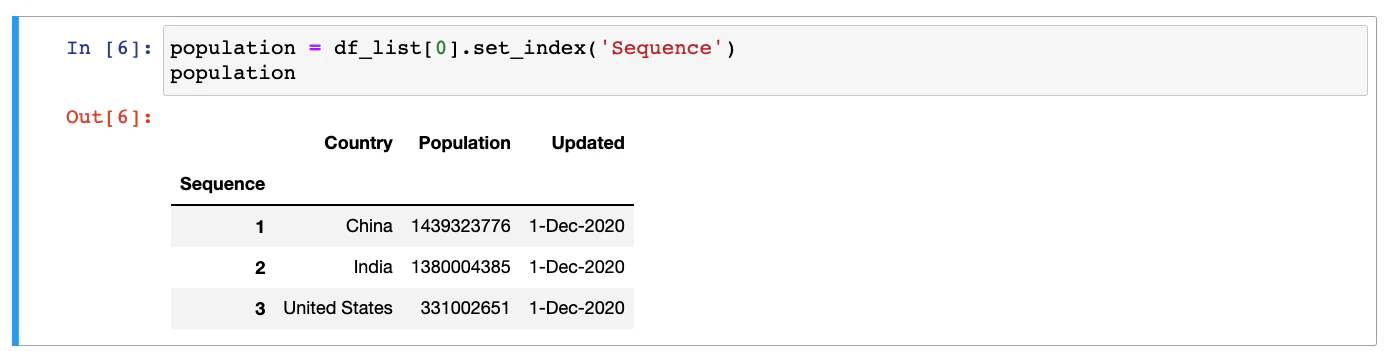
## Cleanup and processing of HTML table data
The index column can be easily updated by calling the `set_index()` function of the DataFrame:
```
population = df_list[0].set_index('Sequence')
```
Once again, let’s take a look at the output from the Jupyter Notebook of this new DataFrame.
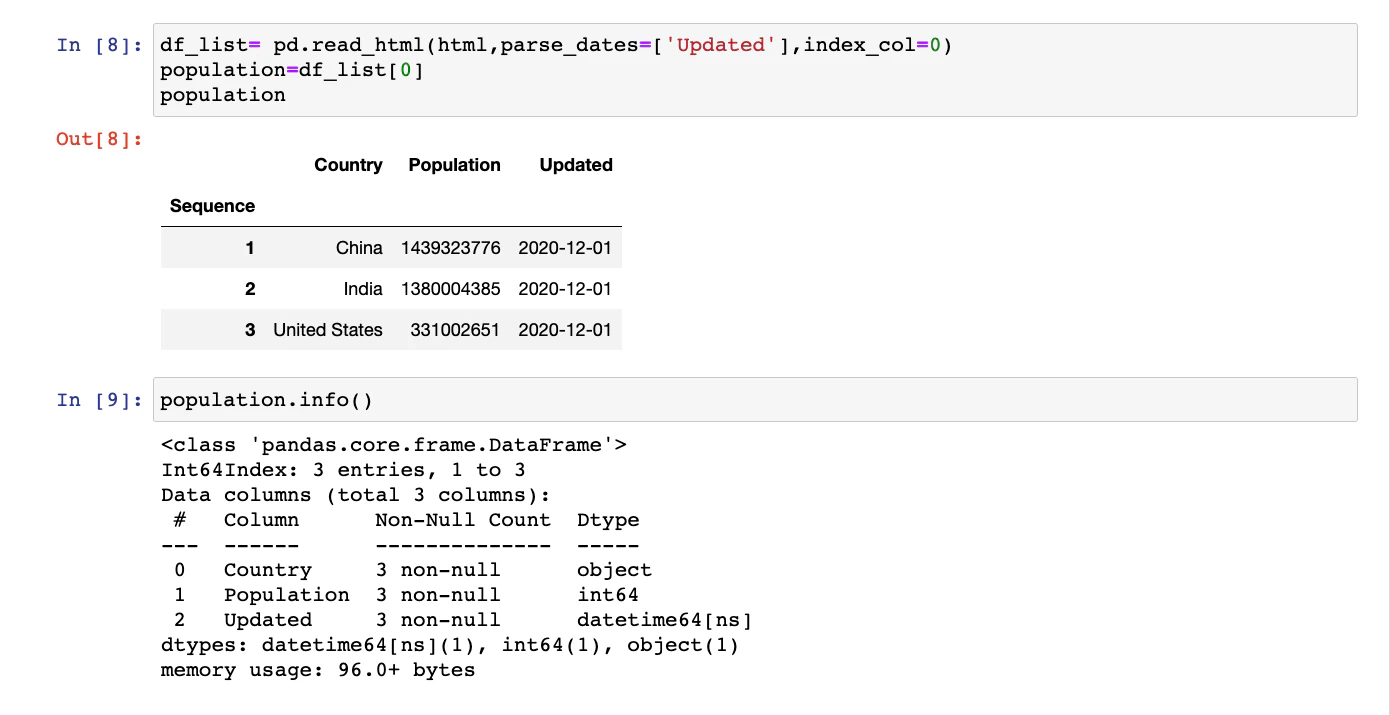
The data types can be checked by calling `info()` function of the DataFrame as follows:
```python
population.info()
```
The output will be as follows:
```shell
Int64Index: 3 entries, 1 to 3
Data columns (total 3 columns):
# Column Non-Null Count Dtype
--- ------ -------------- -----
0 Country 3 non-null object
1 Population 3 non-null int64
2 Updated 3 non-null object
dtypes: int64(1), object(2)
```
Note the `Dtype` for the column `Updated` is `object`. It means that pandas `read_html` function didn’t understand that this column is date.
There are multiple ways to do this. The easiest of these methods is to use one more parameter of the pandas `read_html` function. This parameter is `parse_dates`:
```python
pd.read_html(html, parse_dates=[3])
# OR
pd.read_html(html, parse_dates=['Updated'])
```
This time, if the `.info()` function is called, the DataFrame will have correct data types:
## Invalid and imperfect HTML
The HTML that we used in the previous example is valid. If the heading in the HTML table is embedded in regular `` and `` tags, the DataFrame will be created with default numeric columns.
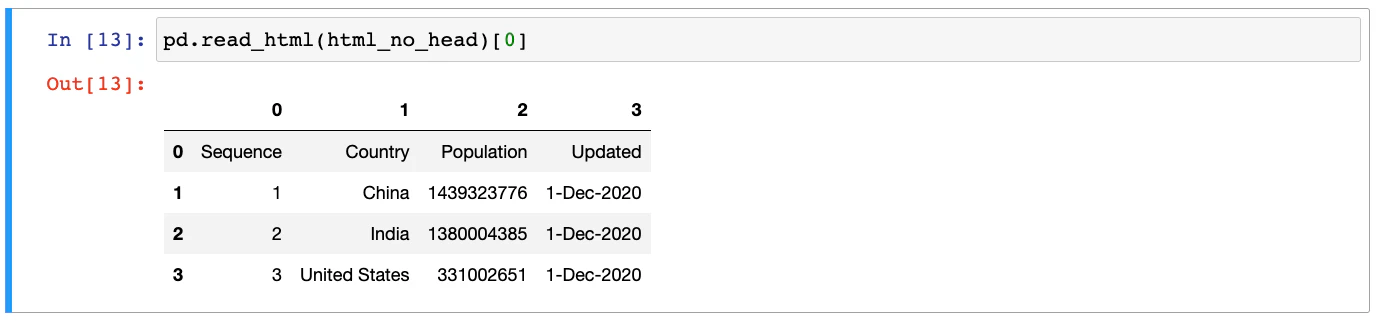
In such cases, you can use another optional parameter of pandas `read_html` method as follows:
```python
pd.read_html(html_no_head,header=0)
```
## Extracting HTML tables from files
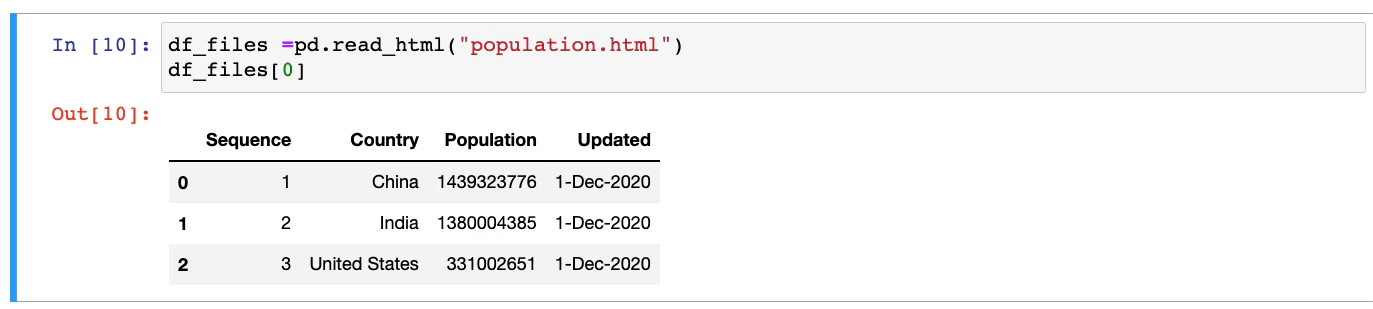
Extracting data from HTML tables that are in HTML files is almost the same as reading from strings.
Instead of the HTML string, the pandas `read_html` needs the file path, relative or absolute. Assuming that the **population.html** file contains the HTML table with population information which is currently located in the **tmp** folder, we can read the HTML table as follows:
```
population_file= pd.read_html("/tmp/population.html",parse_dates=['Updated'],index_col=0)
population_file[0]
```
## Extracting HTML tables from URLs
Pandas can directly connect to web URLs and read HTML tables. This functionality can be used for further [Python web scraping](https://oxylabs.io/blog/python-web-scraping).
The first step is to extract the list of tables using the Pandas `read_html` function. Next, we’ll check the length of the tables returned.
```python
import pandas as pd
list_of_df = pd.read_html("https://en.wikipedia.org/w/index.php?title=Science_Fiction:_The_100_Best_Novels&oldid=1091082777")
len(list_of_df)
# OUTPUT: 7
```
To get to the exact table, there are multiple approaches possible.
To use regular expressions, first, we need to identify any pattern inside the `` that we want to scrape. Open the URL in a browser, right-click the table, and click inspect.
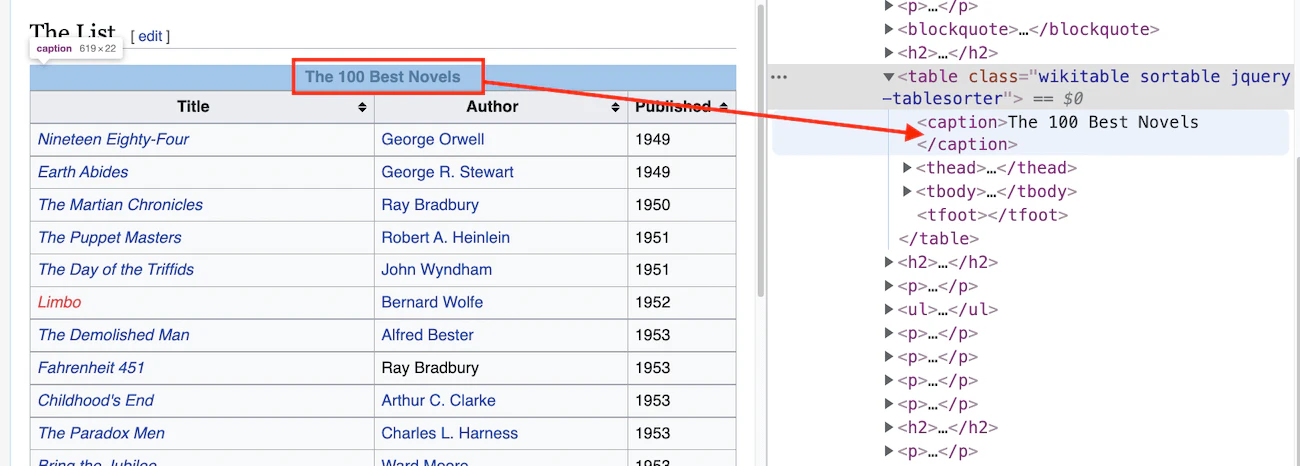
This regular expression can now be supplied to the optional parameter match of the pandas `read_html` function.
```python
import pandas as pd
list_of_df = pd.read_html("https://en.wikipedia.org/w/index.php?title=Science_Fiction:_The_100_Best_Novels&oldid=1091082777", match='The 100 Best Novels')
len(list_of_df)
# OUTPUT: 1
```
One more way to extract the required table is by using the specific attributes:
```python
pd.read_html("https://en.wikipedia.org/w/index.php?title=Science_Fiction:_The_100_Best_Novels&oldid=1091082777", attrs={'class':"wikitable"})
```
## Analyzing and visualizing scraped data
Let’s find the author who has written most of the books in this Top 100 list:
```python
df=list_of_df[0]
df.value_counts(subset=['Author'])
```
This will print the following pandas series:
```python
Author
Philip K. Dick 6
J. G. Ballard 4
Robert A. Heinlein 3
Brian Aldiss 3
Thomas M. Disch 3
..
```
It gives us the information that Philip K. Dick has written 6 books out of these 100 best books. If needed, you can also plot charts to represent the same information.
```python
df = df.value_counts(subset=['Author']).reset_index(name='BookCount')
```
The next step is to make a subset of this DataFrame, where authors have published 3 or more books out of these Top 100:
```python
top_df = df[df['BookCount'] >= 3]
print(top_df)
```
The output will be the following DataFrame:
```python
Author BookCount
0 Philip K. Dick 6
1 J. G. Ballard 4
2 Robert A. Heinlein 3
3 Brian Aldiss 3
4 Thomas M. Disch 3
```
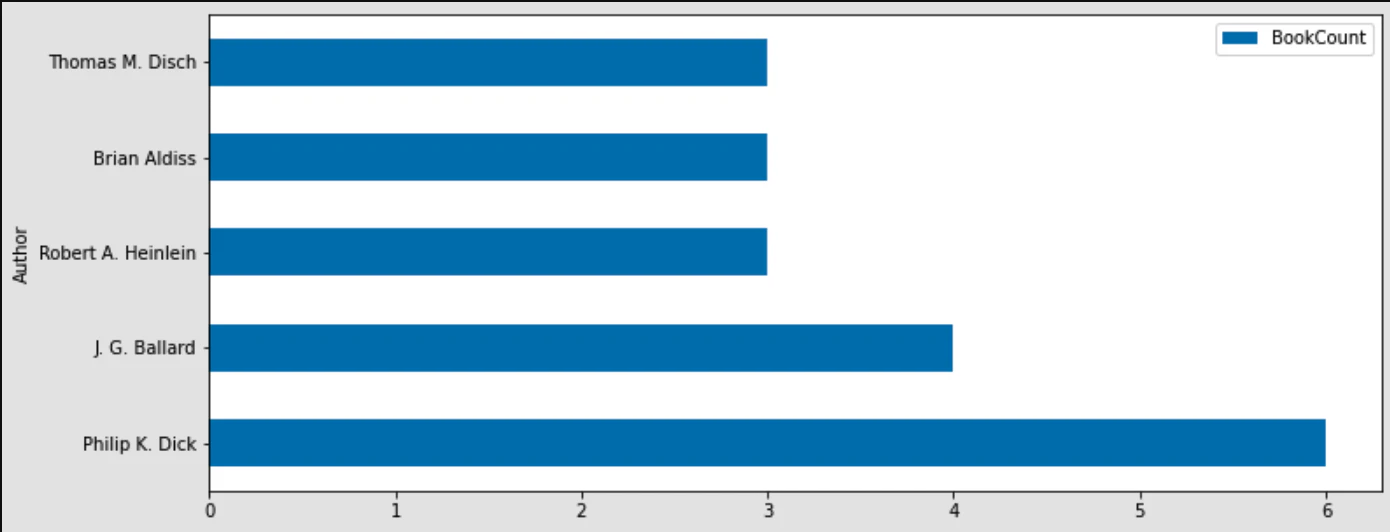
And finally, this data can be plotted as a horizontal bar chart:
```python
top_df.plot.barh(x='Author',y='BookCount',figsize=(12,5))
```
If you wish to find out more about How to Read HTML Tables with Pandas, see our [blog post](https://oxy.yt/hrFW).