https://github.com/parezj/ultrasonic-shm-signal-analysis
Ultrasonic Detection of Composite Material Delamination via SHM UGW Lamb Wave - (PLI, CSI, ECI) - Linux C OOP library
https://github.com/parezj/ultrasonic-shm-signal-analysis
analysis csi ctu delamination eci envelope interpolation linux ndt oop pli shm signal-processing ultrasonic ultrasonic-shm-analysis ultrasound
Last synced: 4 months ago
JSON representation
Ultrasonic Detection of Composite Material Delamination via SHM UGW Lamb Wave - (PLI, CSI, ECI) - Linux C OOP library
- Host: GitHub
- URL: https://github.com/parezj/ultrasonic-shm-signal-analysis
- Owner: parezj
- License: mit
- Created: 2020-05-12T08:15:30.000Z (over 5 years ago)
- Default Branch: master
- Last Pushed: 2020-06-24T20:45:31.000Z (over 5 years ago)
- Last Synced: 2025-05-02T18:53:14.661Z (7 months ago)
- Topics: analysis, csi, ctu, delamination, eci, envelope, interpolation, linux, ndt, oop, pli, shm, signal-processing, ultrasonic, ultrasonic-shm-analysis, ultrasound
- Language: C
- Homepage:
- Size: 26.1 MB
- Stars: 16
- Watchers: 1
- Forks: 3
- Open Issues: 0
-
Metadata Files:
- Readme: README.md
- License: LICENSE
Awesome Lists containing this project
README
# Ultrasonic SHM UGW Signal Analysis - Composite Material Delamination Detection
1. [Introduction](#1-Introduction)
2. [Ultrasonic SHM](#2-Ultrasonic-SHM)
3. [Problem definition](#3-Problem-definition)
4. [Selection of interpolation method](#4-Selection-of-interpolation-method)
5. [Library implementation](#5-Library-implementation)
6. [Use of the library](#6-Use-of-the-library)
7. [Analysis of used methods](#7-Analysis-of-used-methods)
8. [Identification of delamination](#8-Identification-of-delamination)
9. [Conclusion](#9-Conclusion)
10. [References](#10-References)
The aim of this work was to develop an efficient algorithm for evaluation
mutual shift of signals obtained during ultrasonic SHM by UGW method. Principle
The method used is based on the identification of local maxima, their interpolation
by a suitable course and finding the global maximum of this course. For interpolation
3 different techniques (PLI, CSI and ECI) were chosen for maxima. The signals shift subsequently
used to detect delamination of the tested composite material. The result is
distributed in the form of a C language library designed to meet general PPE
paradigm. Input and output data are in CSV format, which is used in
subsequent analysis in the MATLAB environment. The library was successfully tested on the system
Linux.
## 1. Introduction
Damage detection and especially prevention is an important part of most industries
industry, where, for example in aviation or aerospace, it is necessary and
key element. Modern SHM methods using the principles of NDT (non - destructive testing)
testing) have recently become increasingly emphasized in both scientific and
environment and in practice.
Non-destructive testing aims to estimate residual life or risk
associated with the use of a particular thing. In other words, using non-invasive techniques
discover hidden defects that could only be detected by standard methods
(partial) destruction of the thing. The history of NDT dates mostly to 1895,
when X-rays were discovered, and thus began a new era of looking at objects without them
damage. Today, it is commonly diagnosed non-destructively with, for example,
electromagnetic, acoustic, optical, radiographic or thermal
methods.
The general quality of the test is enhanced by an appropriate combination of these techniques, however,
that as the complexity grows, so does the difficulty, and therefore the required expertise
qualifications and *know-how*. This is especially true for NDT, because it almost always does
it is not a simple and straightforward solution. When designing such a system is first
it is necessary to analyze the situation, select a group of tested physical principles,
develop a test method and build a measuring chain. In the next steps, the data
measured and subsequently evaluated.
However, there is no guarantee that the data must be relevant or meaningful
the result will be quite conclusive. Because sometimes looking for clues that prove
It is necessary to proceed very much before changing the material before it occurs
carefully and with some foresight and experience. It follows that NDT can be
very time-consuming, financially and personally demanding. On the other hand, you can
predict critical system failures and thus save costs or even save
human lives.
## 2. Ultrasonic SHM
Ultrasonic non-destructive testing uses higher sound waves
frequencies than what can be heard by humans, from about 20 kHz to tens to
hundreds of MHz. This ripple is transmitted to the test material by which it partially
it passes through and partially bounces off it. There are various methods, such as UT
(*Ultrasonic Testing*) or UGW (*Ultrasonic Guide Wave testing*).
In the UT method, the test string usually consists of a signal generator,
transmitter, receiver and signal analyzer. The generator and analyzer are
classically formed by one device, which is visually similar to an oscilloscope.
The transmitter and receiver can be used combined or dual, most commonly used today
uses the piezoelectric effect for these purposes. The silicon membrane converts
electrical energy to mechanical, and thus serves as a key element for transmission
and acoustic signal reception. The principle is to send a wave to the test
material and in the measurement of reflections. If there is a crack inside the homogeneous object,
will appear on the screen as *peak* between two *peaks*, which indicates a reflection from
surface, respectively from the bottom of the object.
The UGW method is most often used for pipeline inspection or detection
delamination of objects. It is based on the propagation of a longitudinal (*Lamb*) wave through a surface
(or just below the surface) of the test material from one point to another. See
by changing the thickness of the material, the speed of propagation of the ultrasonic wave also changes. Thanks to
it is possible to find even a slight one by comparing the reference and the tested signal
structural defect.
## 3. Problem definition
We obtained data from measurements using the UGW method. These are digital samples
ultrasonic waves that penetrated the surface of the tested composite object
from point A to point B. Several waves were measured. The first is reference and corresponds
signal without any structural defects. Additional waves were tested on
materials with a certain degree of delamination. The aim is to correctly identify and
possibly determining the degree of this delamination.
At first, the naked eye cannot say anything about this data. It is necessary to compare the measured waves
with reference. The solution to this problem is to find the global envelope maximum
signals. By subtracting the global maxima of the measured wave envelopes from the global maximum
reference we get the shift of a specific signal. We move the whole by this value
wave and plot it together with the reference wave. It is now clear that
if a defect has occurred. If the wave was copying the reference, it was moving the same
speed and the material should be free of defects. Otherwise, it probably happened
to change the thickness of the material. The degree of delamination can then be determined, if known
wave propagation speeds in both materials.
The signal envelope can be obtained in various ways. Among the most used are
low-pass filtering, Hilbert transform, correlation, or interpolation
local maxima by a suitable course. The latter method was chosen for
use in this work.
## 4. Selection of interpolation method
The identification of local maxima in a discrete signal is trivial and unambiguous.
However, their connection is not trivial. There are many methods where none exist
universal. It always depends on the situation. Most often you can meet with constant,
linear, cubic or *sinc* interpolation. In our case, it seems appropriate
linear and cubic. We will also use experimental ECI interpolation for comparison.
### PLI - Piecewise Linear Interpolation
Linear interpolation is the simplest and fastest after constant interpolation.
To determine the equation of a line between two points, it is enough to know the coordinates of the endpoints.
In our case, we don't even have to know it, because we're looking for a global maximum, and that's it
certainly located in an already known point.
### CSI - Cubic Spline Interpolation
Cubic interpolation is the connection of points to 3rd degree polynomials that together form
continuous function with continuous first and second derivatives. We distinguish
*natural*, *clamped* and *not-a-knot* cubic interpolation. In our case
we choose the type *natural*, which has the second derivative in the first and in the last segment
equal to 0. Cubic interpolation is more complex than linear,
each segment needs to solve a system of linear equations. It also depends on the amount
interpolated points. More point means longer calculation, larger resulting data
file, but also a more faithful signal reconstruction. Fewer points is faster, however
the signal may be jagged. Therefore, it is important to choose the right compromise.
### ECI - Extremum Center Interpolation
This interpolation method is mainly used to find the IMF components of the signal,
however, it may be interesting to test it to evaluate the shift. Alternately
proceeds through the found local maxima and minima. Always to one local
extreme, a complementary point is found lying at the intersection of the vertical line and the line
intersecting two opposite extremes. The centers of these points are then joined by a cubic
interpolation.
## 5. Library implementation
C language is an ideal choice for solving similar problems. From the library
required speed, determinism, and portability. If done correctly,
the C language fulfills everything. The library is named *shm_shift.c* and is represented
an *shm_shift_t* object that is of type * struct *. It is located in this structure
all data. It is mainly an array of *signal* objects of type *struct*, which
represent the analyzed signals, and the *csv_parser* object. Although it may seem that
CSV file processing is trivial, it is unnecessary to reinvent the wheel when
it can use a tested and functional solution, especially if it is only a support
functionality.
The *signal* structure contains the signal name, input data points, local indexes
extremes, interpolated points, centers of extremes, global maximum and minimum
interpolated waveform, and in particular the shift of the signals from the reference in the x-axis.
The library interface can be divided into several logical units. It must first
object to initialize, use the *create* function. Next, the CSV is typically read
file, the data is analyzed and the result is written to CSV files. It will be used for this
*read_csv*, *analyze_csv*, *write_csv*. Alternatively, the signal can be analyzed directly
from data from memory using the *analyze_signal* function. It is necessary to finish correctly
free dynamically allocated data to prevent memory leaks. Function
*dispose_calc* releases analysis data and interpolated points, *dispose_all* except
it also releases input data, and the *free* function eventually releases everything.
The library compiled with GCC takes up 27 KB. In addition to the standard language library
C no external dependencies are used, so it can be integrated into different ones
environments including *embedded* systems.
## 6. Use of the library
Use in the practical case should be straightforward and simple. It is a must have
input data representing acoustic signals in the correct format in a CSV file,
or ideally directly in memory in the *signal* structure. The data is in a CSV file
stored in columns, where the first line is the text name of the signal and the next lines
represent the values of the y-axis. X-axis data is not needed, assuming samples
were taken equidistantly over time.
> Example of input data in CSV format
Dref
D1
D2
D3
D4
D5
‒45
‒51
‒61
‒68
‒43
‒61
‒43
‒50
‒59
‒66
‒42
‒59
‒42
‒49
‒57
‒65
‒40
‒57
> Example of using a library
```c
char* file_in = "./data/data.csv"; /* input file */
char* file_out = "./data/result"; /* output files */
char delim = ';'; /* csv delimiter */
int ni = 10; /* number of interpolated points */
int ref_col = 0; /* number of reference signal column */
/** 1. create library object */
shm_shift_t* shm = shm_shift__create();
/** 2. read input data from CSV file */
int ret1 = shm_shift__read_csv(shm, file_in, delim);
/** 3a. analyse and write output CSV for PLI algorithm */
int ret2 = shm_shift__analyse_csv(shm, PLI, ref_col, 0);
int ret3 = shm_shift__write_csv(shm, file_out, delim);
/** 3b. dispose, analyse and write CSV for CSI algorithm*/
shm_shift__dispose_calc(shm);
int ret4 = shm_shift__analyse_csv(shm, CSI, ref_col, ni);
int ret5 = shm_shift__write_csv(shm, file_out, delim);
/** 4. finally clean up all */
shm_shift__free(shm);
```
In addition to the resulting interpolated waveforms, we are most interested in value
*shift_x_max*. Of course, you can continue to work with it in C language and create it
system for *online* SHM. In our case, it is enough to import the obtained data into
MATLAB environment to work *offline*.
The resulting offset of a specific signal from the reference is now sufficient to subtract. Thus
we plot the adjusted signal together with the reference one in a graph. If we chose
appropriate test wave parameters, generated and measured it correctly, and selected
appropriate interpolation method, we can determine from the graph whether the material has occurred
to delamination.
> Example of analysis of results in MATLAB environment
```matlab
path = "../data/"; % directory with csv files
prefix = "data"; % prefix of those files
data = readtable(path + prefix + ".csv"); % read csv files
results_pli = readtable(path + prefix + "_results_pli.csv");
results_csi = readtable(path + prefix + "_results_csi.csv");
%% plot signals
for i = 2:size(data, 2)
figure; % create figure
x = i * 5; % shift_x_max is in multiples of five
shift_pli = results_pli.(x); % get shift of PLI alg
shift_csi = results_csi.(x); % get shift of CSI alg
% plot data
plot(1:size(data,1), data.(1)); % plot original signal
hold on; % enable multiple plots
grid on; % show grid
plot((1:size(data,1)) - shift_pli, data.(i)); % plot PLI shifted sig.
plot((1:size(data,1)) - shift_csi, data.(i)); % plot CSI shifted sig.
% set figure properties
name = data.Properties.VariableNames(i); % get sig. name
title(string(replace(name, '_', '_{')) + "}"); % title
xlabel('time'); % axis x label
ylabel('value'); % axis y label
legend('reference', 'shifted (PLI)', 'shifted (CSI)'); % legend
end
```
## 7. Analysis of used methods
The ECI method (*Fig. 1*) proved to be unusable. It determined in 6 out of 10 samples
global maximum wrong. It has been confirmed to be particularly suitable for signal decomposition
on IMF functions, for example in the Hilbert Huang transform.
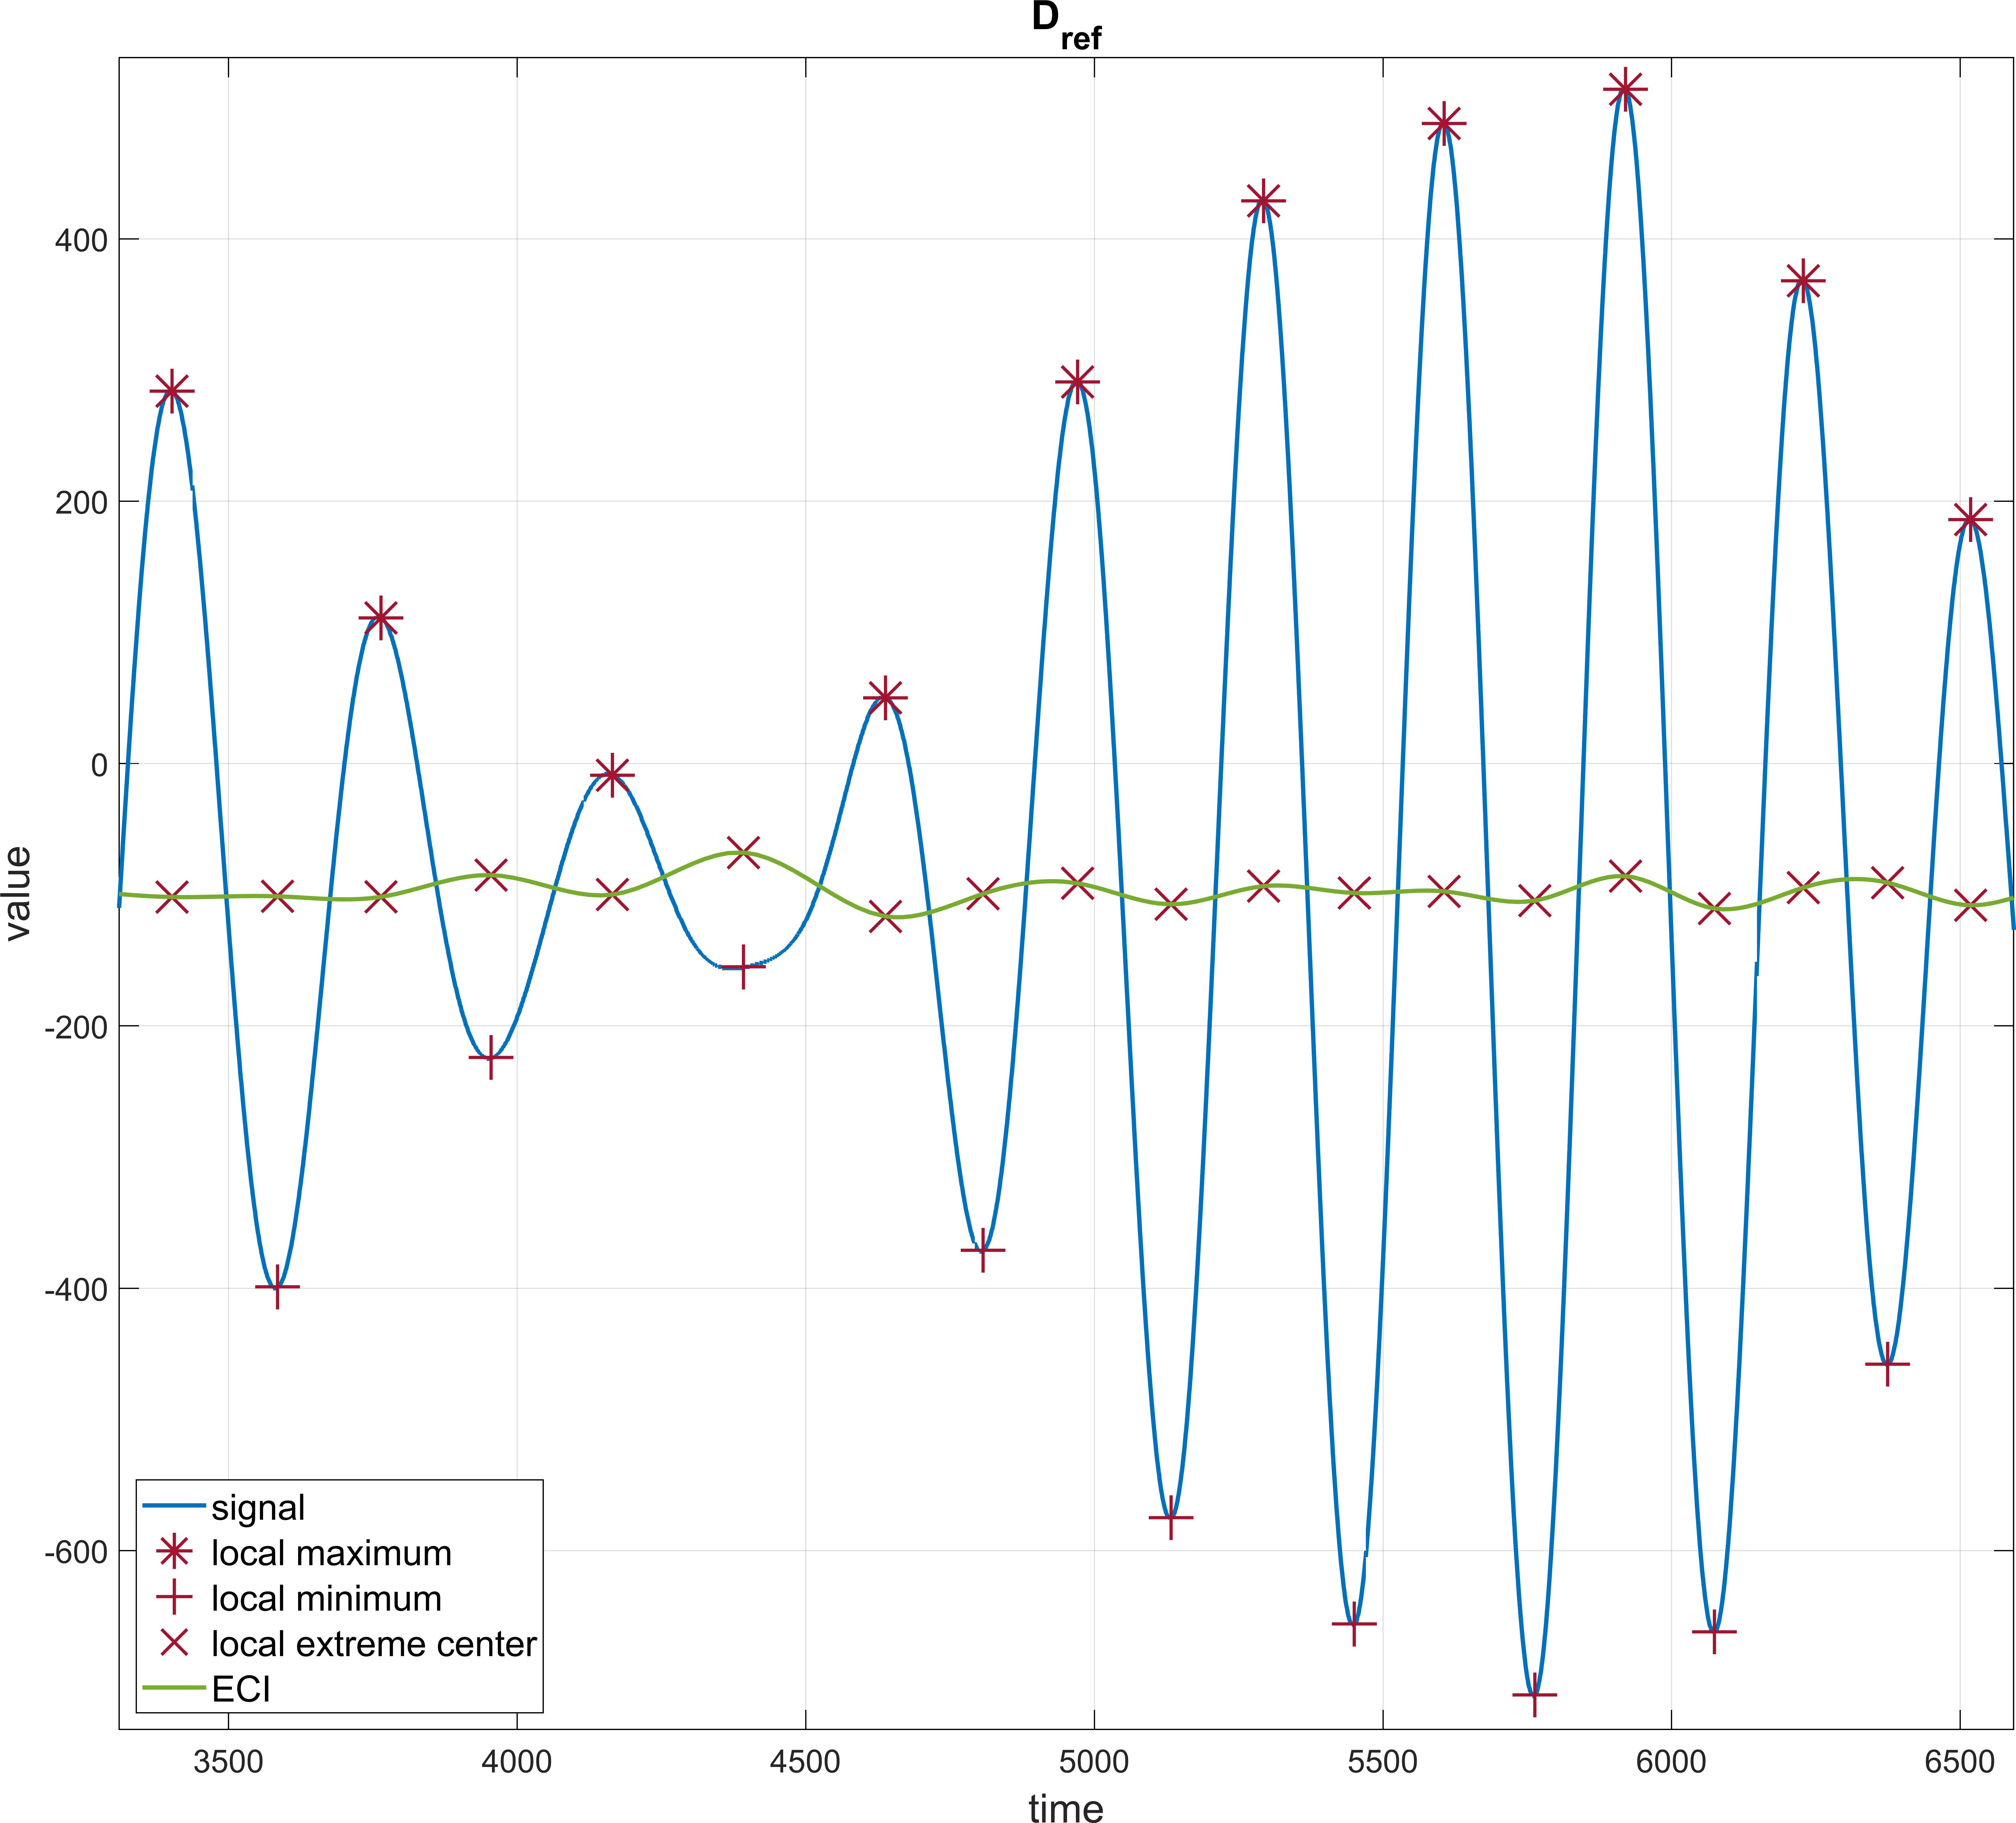
> Interpolation of centers of local extremes by ECI method (green).
Linear PLI interpolation (*Fig. 2*) has its advantages especially in speed.
The mean value of the reference signal of 10300 samples took to calculate at
test PC (*Intel i7 Ivy Bridge* 2.7 GHz) with OS *Linux Ubuntu* about 13 µs.
PLI interpolation on the same assembly lasted approximately 37 µs. However, it must be said that
there is essentially no interpolation. As already mentioned, in the case of PLI
it is enough to identify local extremes and global maximum from already available data
points. There is no need to create another artificially. The resulting ratio of the algorithm calculation time
with respect to the time of calculation of the mean value is 2.9. Unlike CSI and ECI, this value
does not depend on the number of interpolated points.
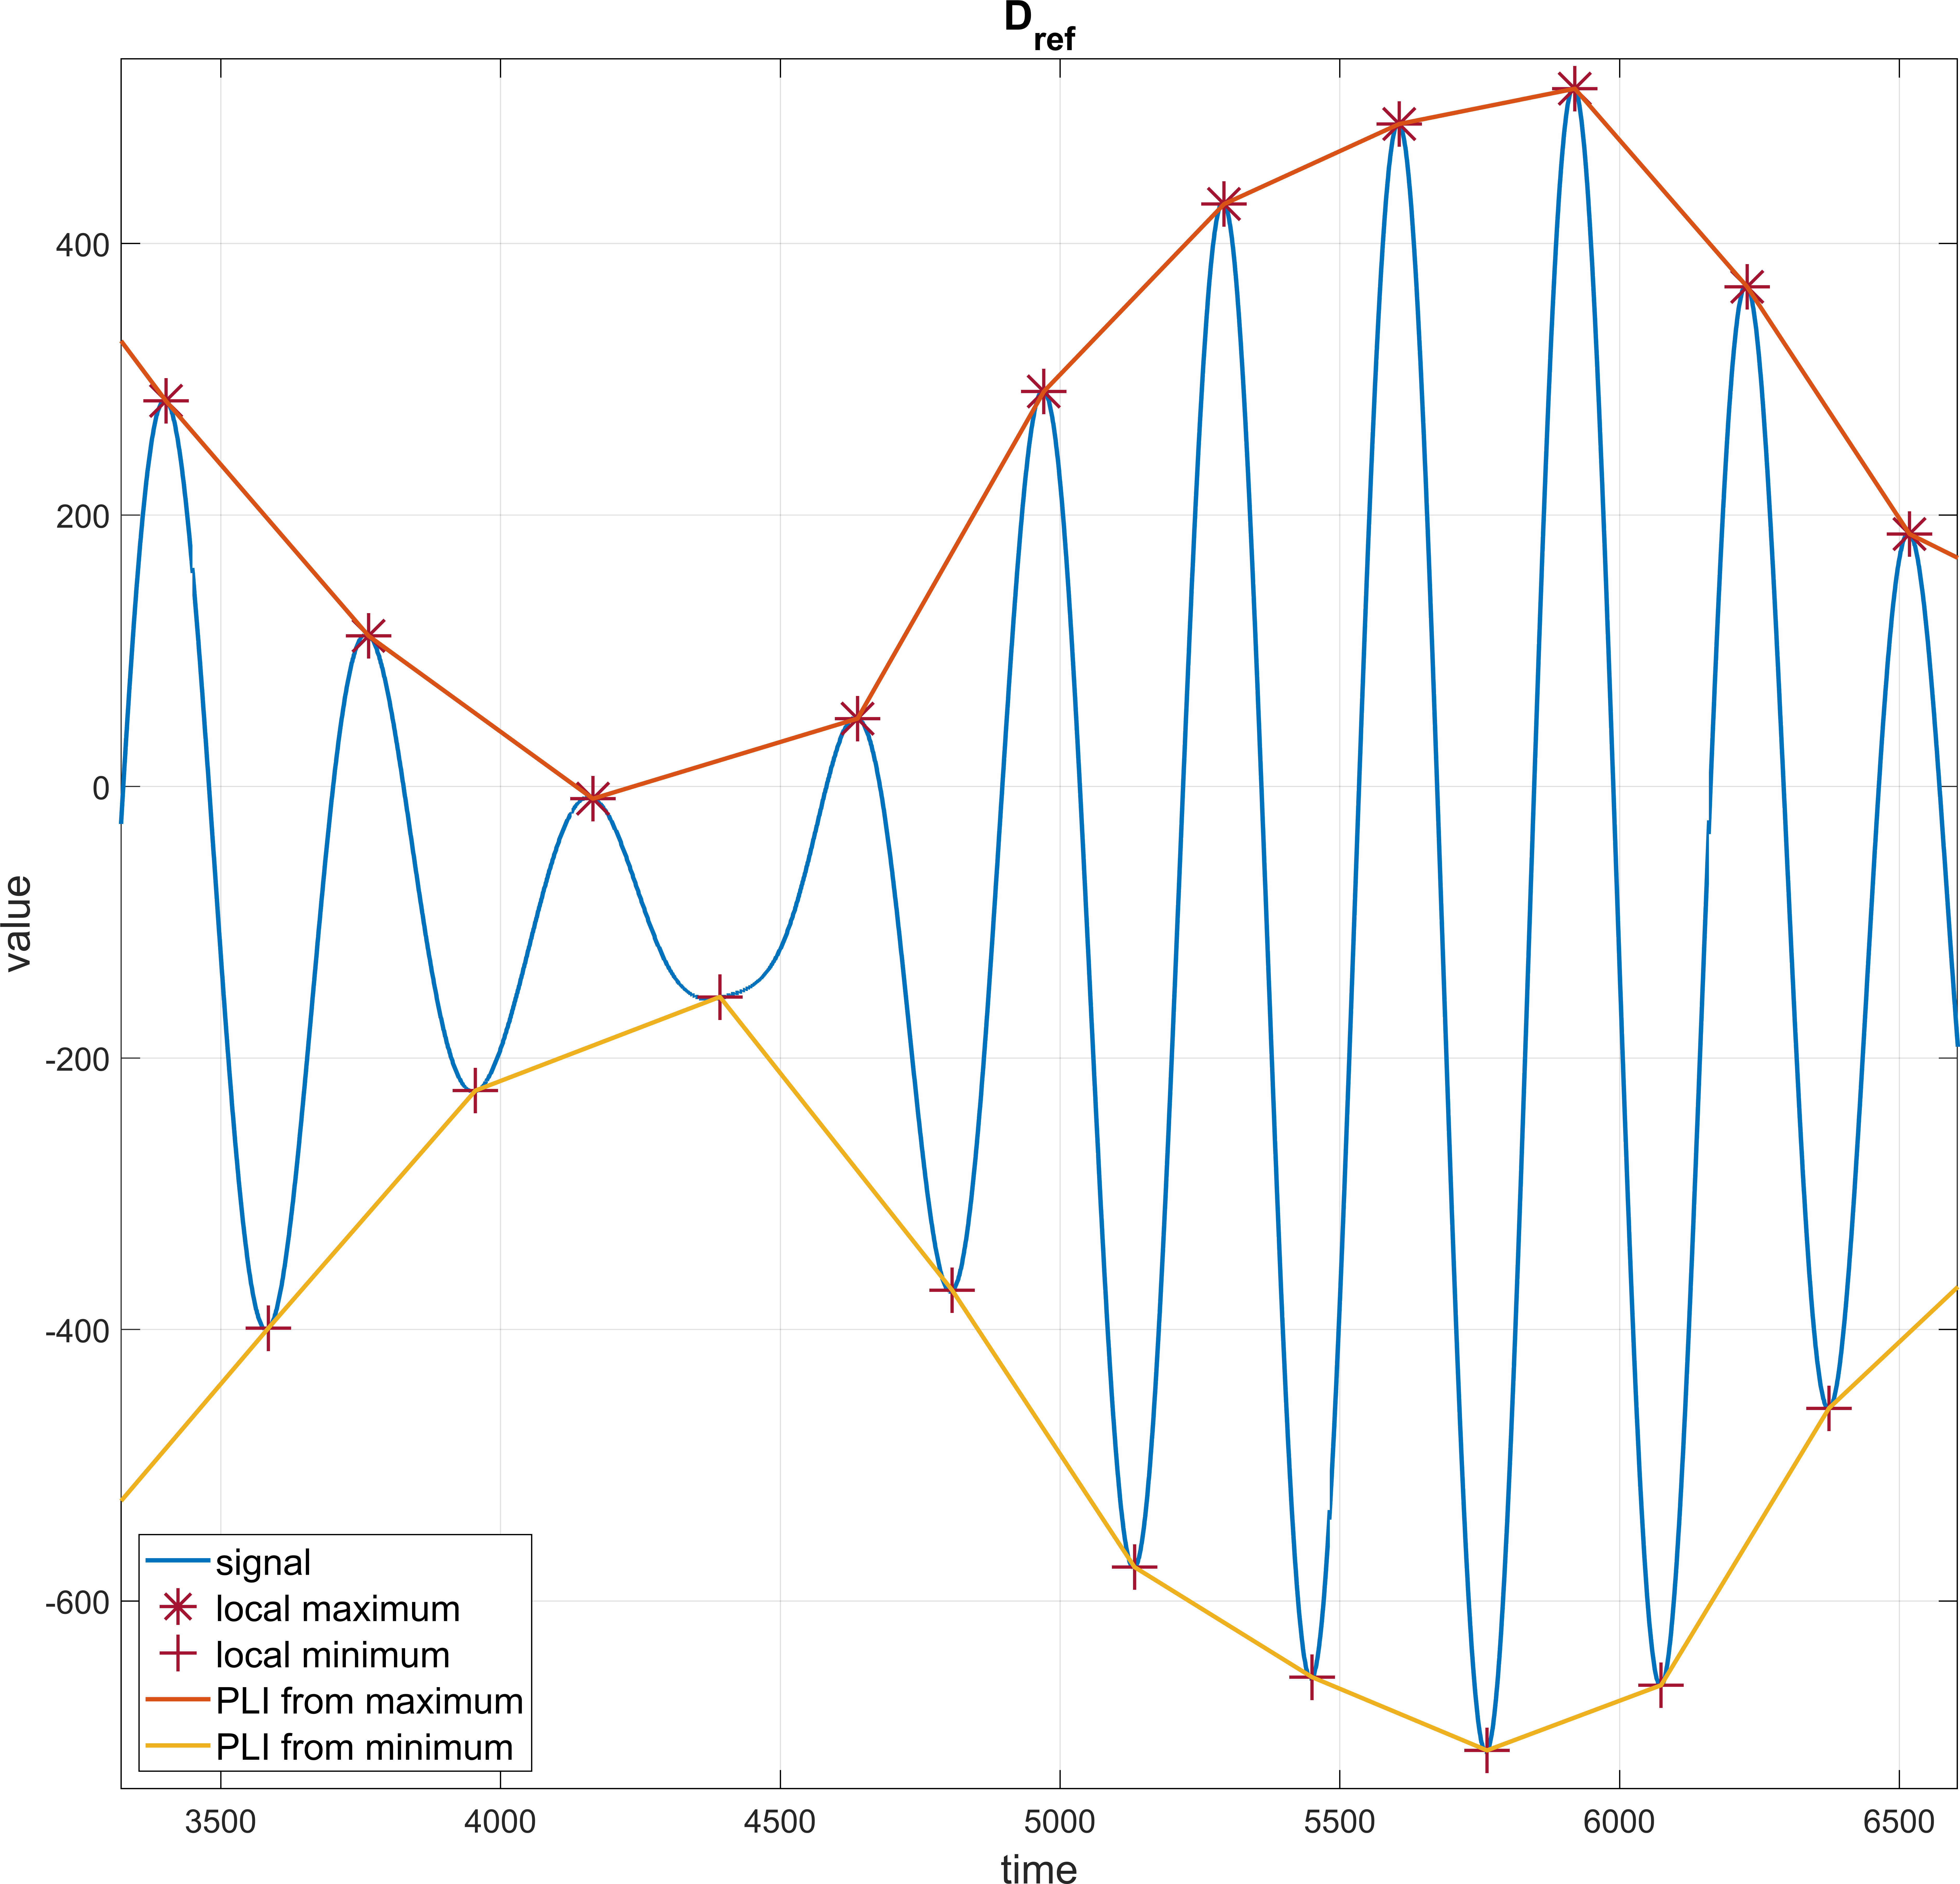
> Interpolation by PLI method. Orange indicates the connection of local maxima,
yellow connection of local minima.
> Comparison of library speed using different methods
ni
mean
(μs)
PLI
(μs)
CSI (μs)
ECI (μs)
PLI
(coef.)
CSI
(coef.)
ECI
(coef.)
100
12.6
36.5
63.3
214.9
2.89
5.04
17.10
10
12.5
36.2
46.9
60.9
2.90
3.75
4.87
3
12.7
36.9
44.4
54.3
2.89
3.49
4.27
1
12.9
37.1
39.7
51.5
2.89
3.09
4.01
The stated values apply to a signal with 10300 samples. This is the average of 100 measurements.
The column *ni* indicates the number of interpolated points and does not make sense for the PLI method.
On the left is the duration in µs. In the right part is the ratio of duration to length
the duration of the calculation of the mean value, which is given in the second column *mean*.
The CSI method is slower than the PLI by microsecond units, it provides
incomparably better results. For 1 point, the calculation took about 40 µs and
the coefficient of velocity was 3.1, for 10 points it was 46.9 µs and the coefficient was
3.8. For 100 interpolated points, the duration of the algorithm increased to 63.3 µs
with a speed coefficient of 5.0. It might seem that amount
interpolated points will significantly affect the overall speed. In fact, however
these are units of microseconds. For online analysis (for example in *embedded*
equipment) would certainly be a relevant factor, but in our case it does not play
no role. The field size of the interpolated signal is directly proportional to what is discussed
parameter *ni*, the specific value can be calculated as $$ \ left \ lbrack (1 +
\ text {ni}) \ bullet \ text {pts} \ right \ rbrack - \ text {ni} $$. Amount
interpolated points is marked as *pts*, in our case it is a number
local maxima or minima, respectively.
From *FIG. 3* it is obvious that 1 or 3 points are not insufficient for correct analysis.
For specific input data, 100 points seems to be unnecessarily too much, therefore
choose 10 points as the default value for further calculations.
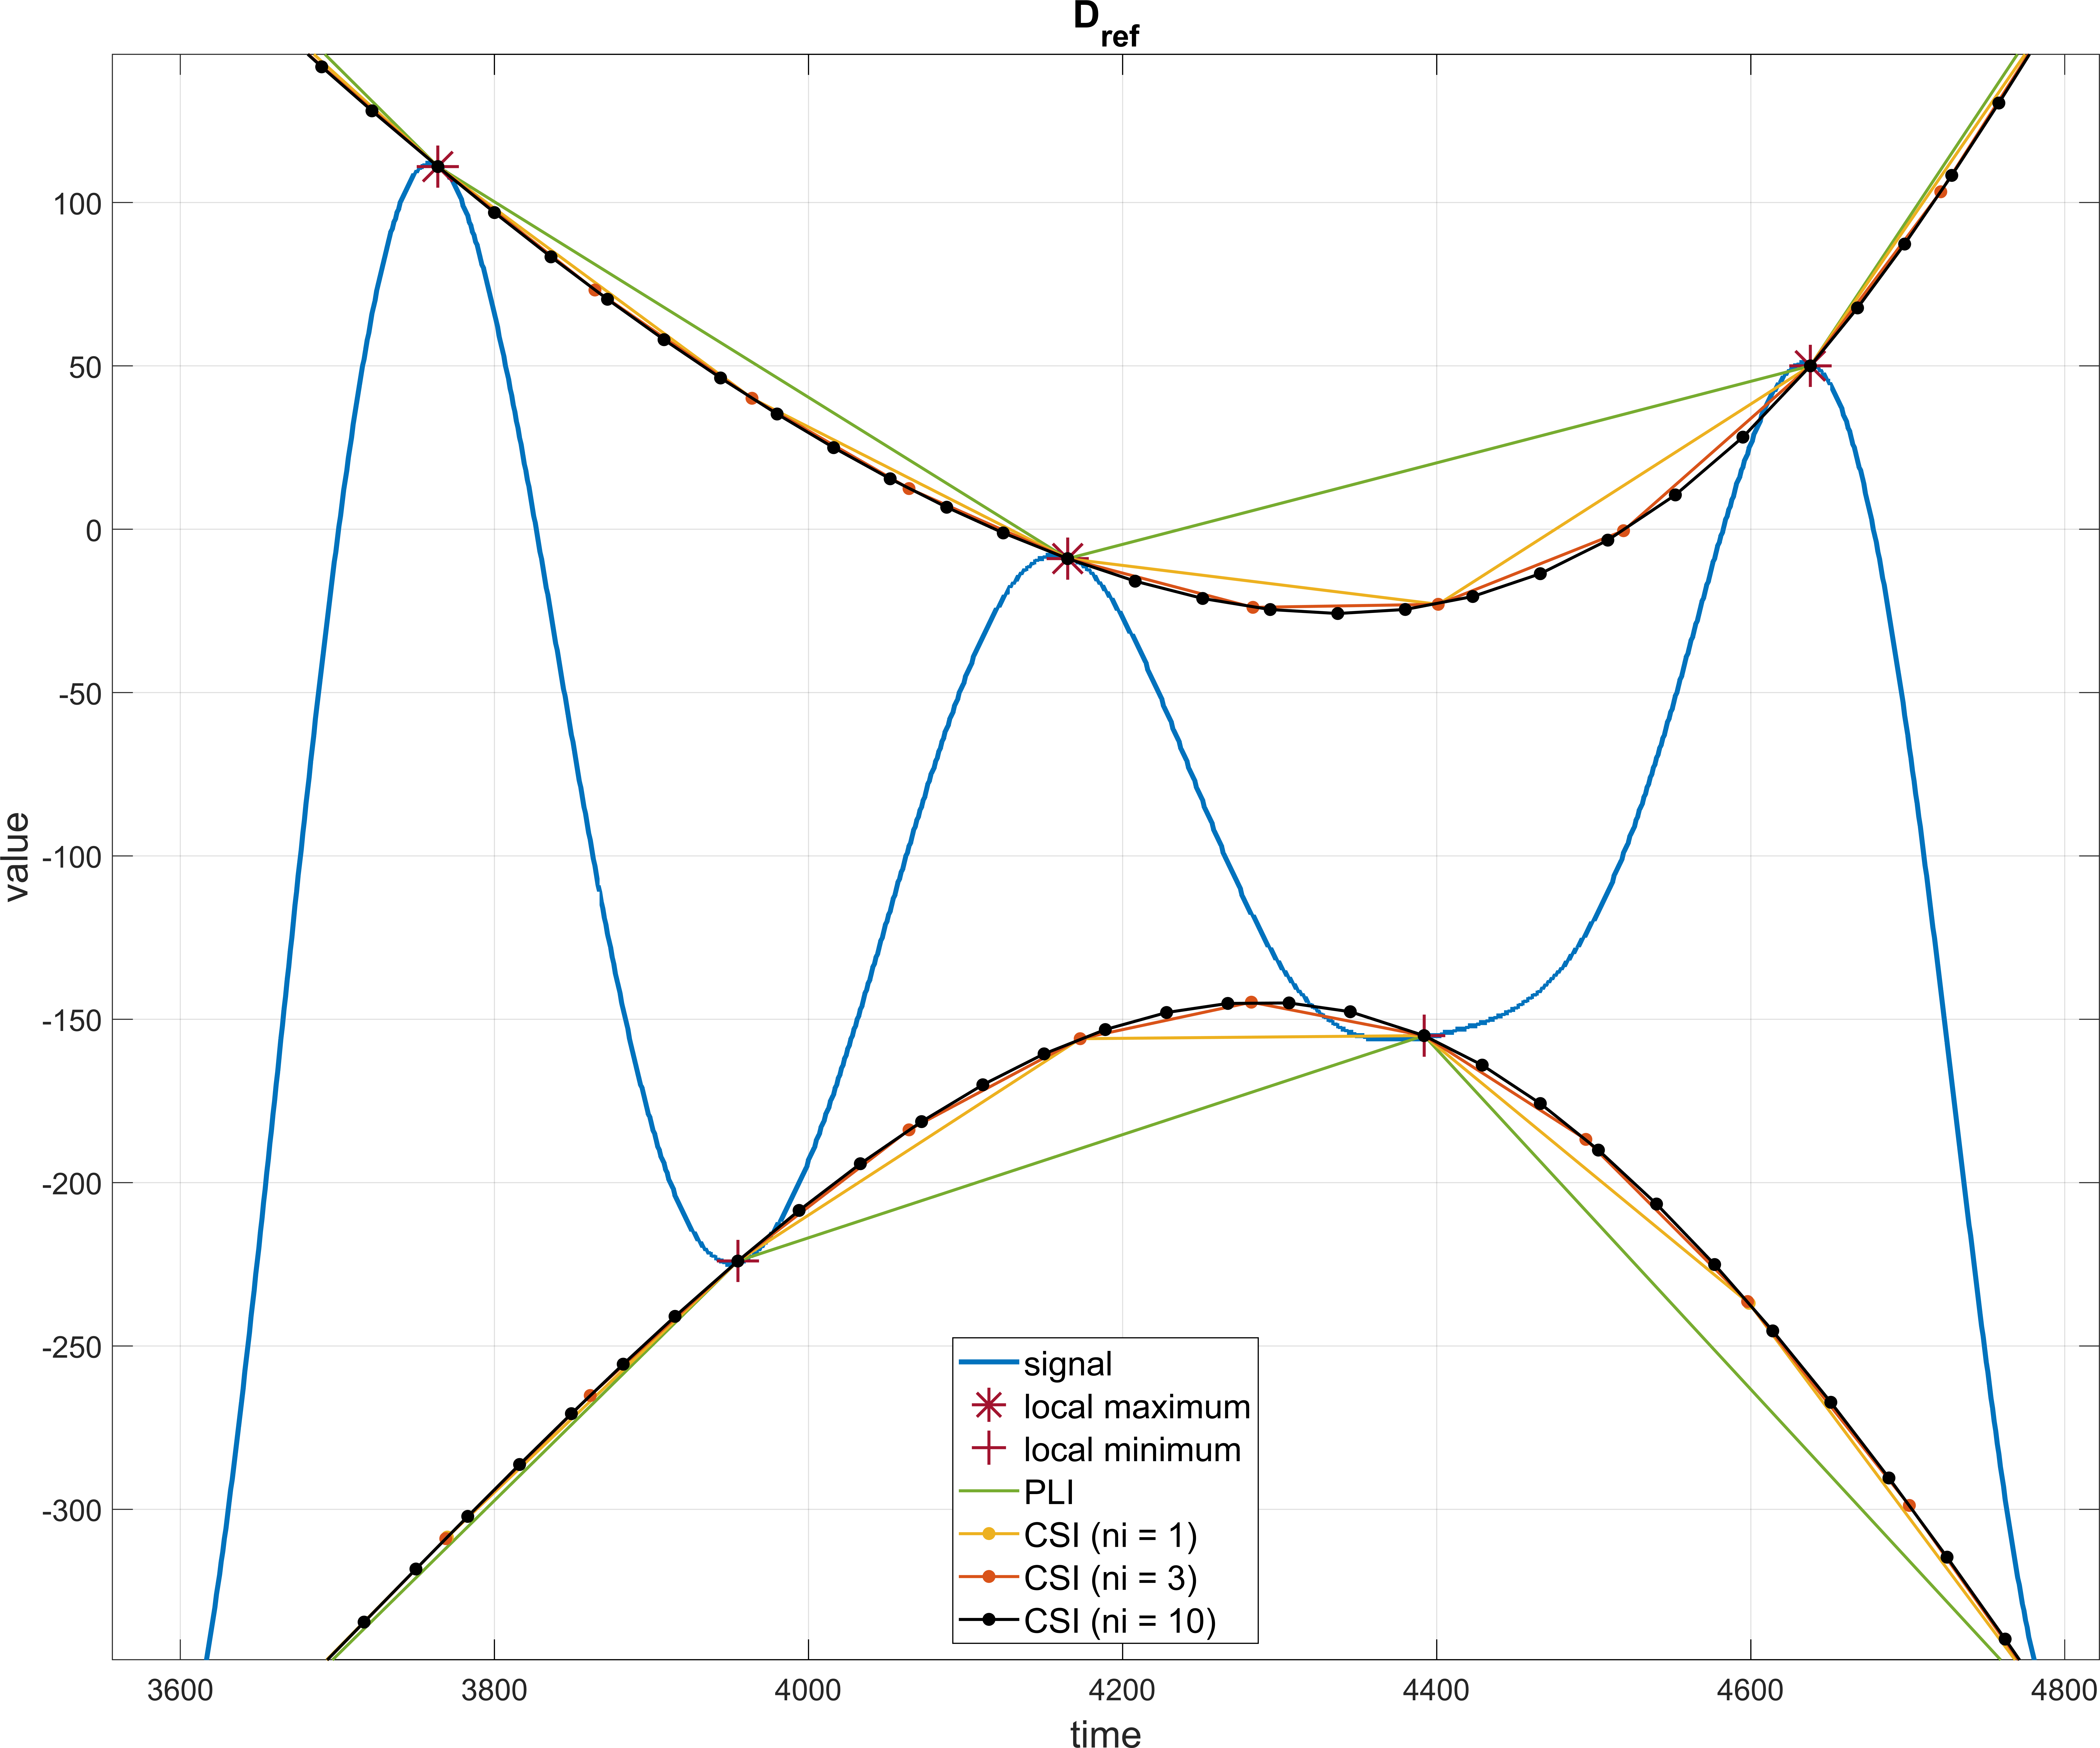
> CSI interpolation. The use of 1 interpolation point is marked in yellow,
orange 3 points, black 10 points and green is marked PLI interpolation for comparison.
## 8. Identification of delamination
We now have almost everything we need to identify delamination
tested material. We use the CSI method with 10 interpolation points and obtain
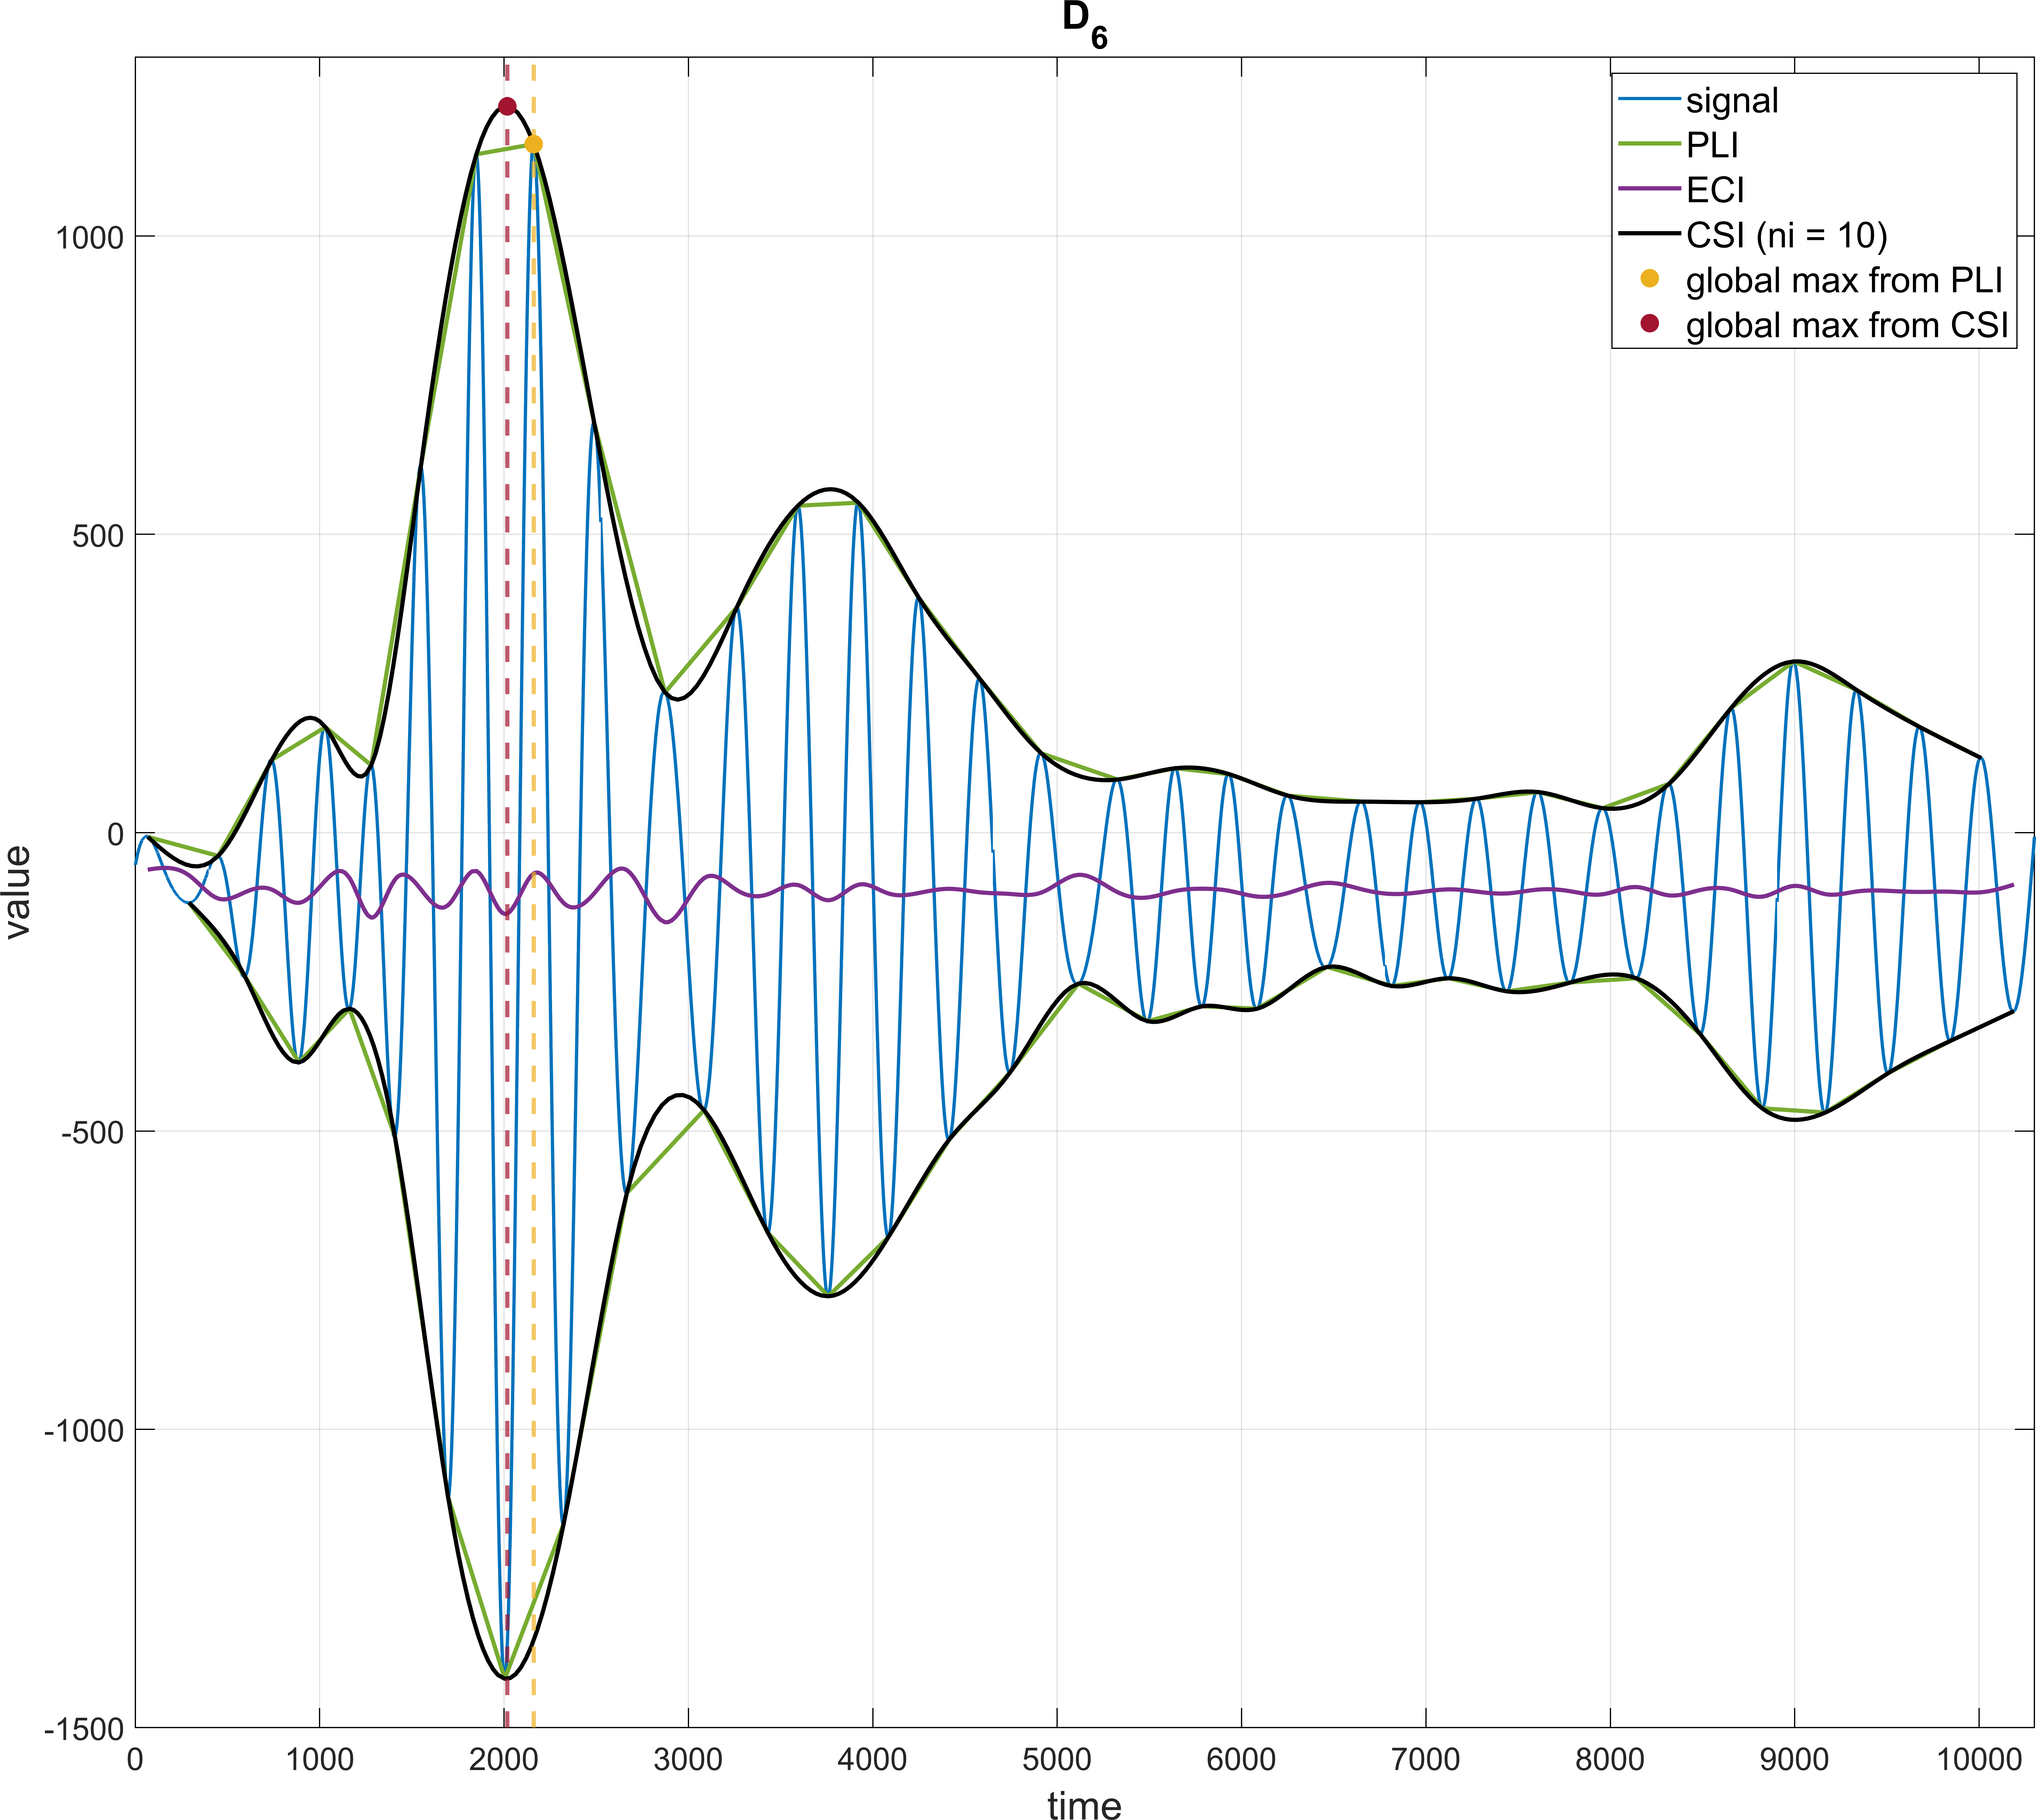
global maximum signal envelope. In *FIG. 4* you can see how it differs globally
maximum when using the PLI and CSI methods. Linear interpolation provides
a distorted notion of where the global maximum is actually located.
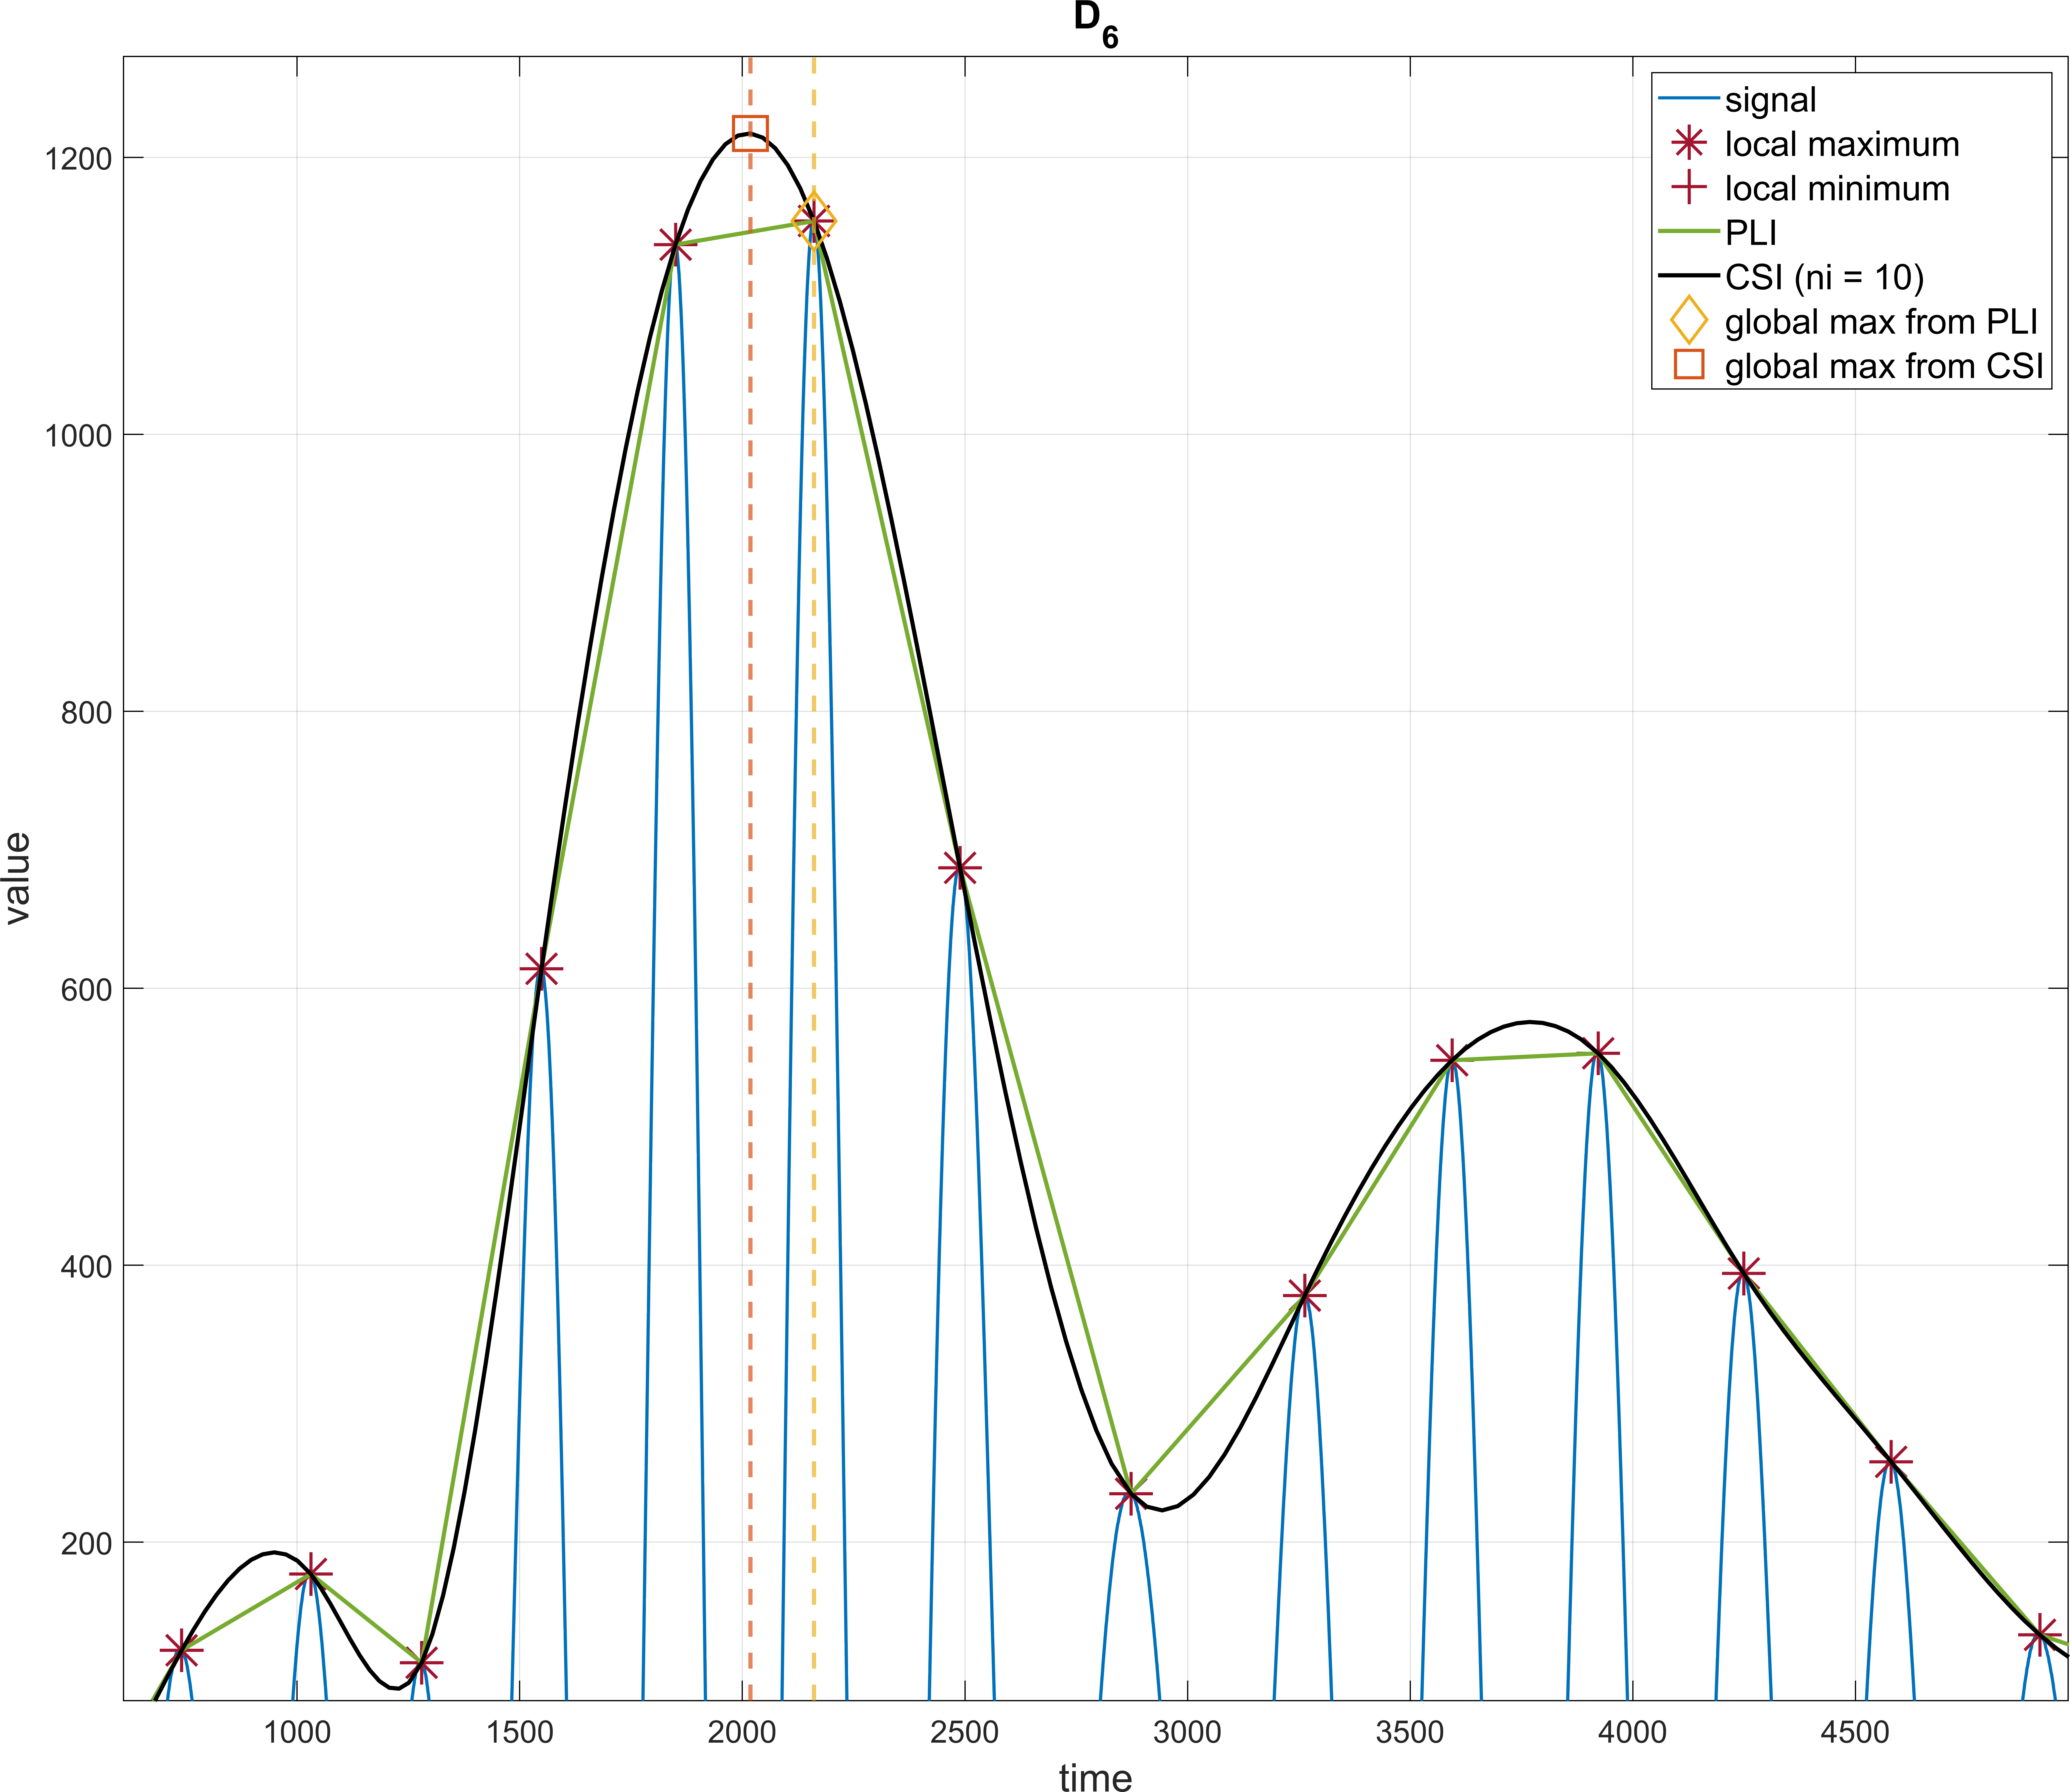
> Comparison of the global maximum determined by the CSI method (orange square)
and using the PLI method (yellow diamond on the right).
The shape of the resulting envelope is not important. To illustrate the form of ultrasound generated
waves can be observed *Fig. 5*.

> Test signal envelope generated by CSI method (black). For comparison
PLI interpolation is highlighted in green and ECI interpolation in purple.
The last step is to subtract the obtained offset from the tested signal and clogging
to the chart along with the reference. The interpolation method used is significantly reflected here,
because it determines the global maximum from which the shift is calculated. When
linear interpolation occurs due to inaccurate determination of the global maximum
bias of results. The waves are aligned to the maximum value, which leads
to incorrect localization of material delamination. This can be seen in *Fig. 6*. In the left
part you can see the overlap of both waves, indicating the same rate of propagation and thus
the absence of a defect, which is wrong, however, because it is a sample with the present
delamination.
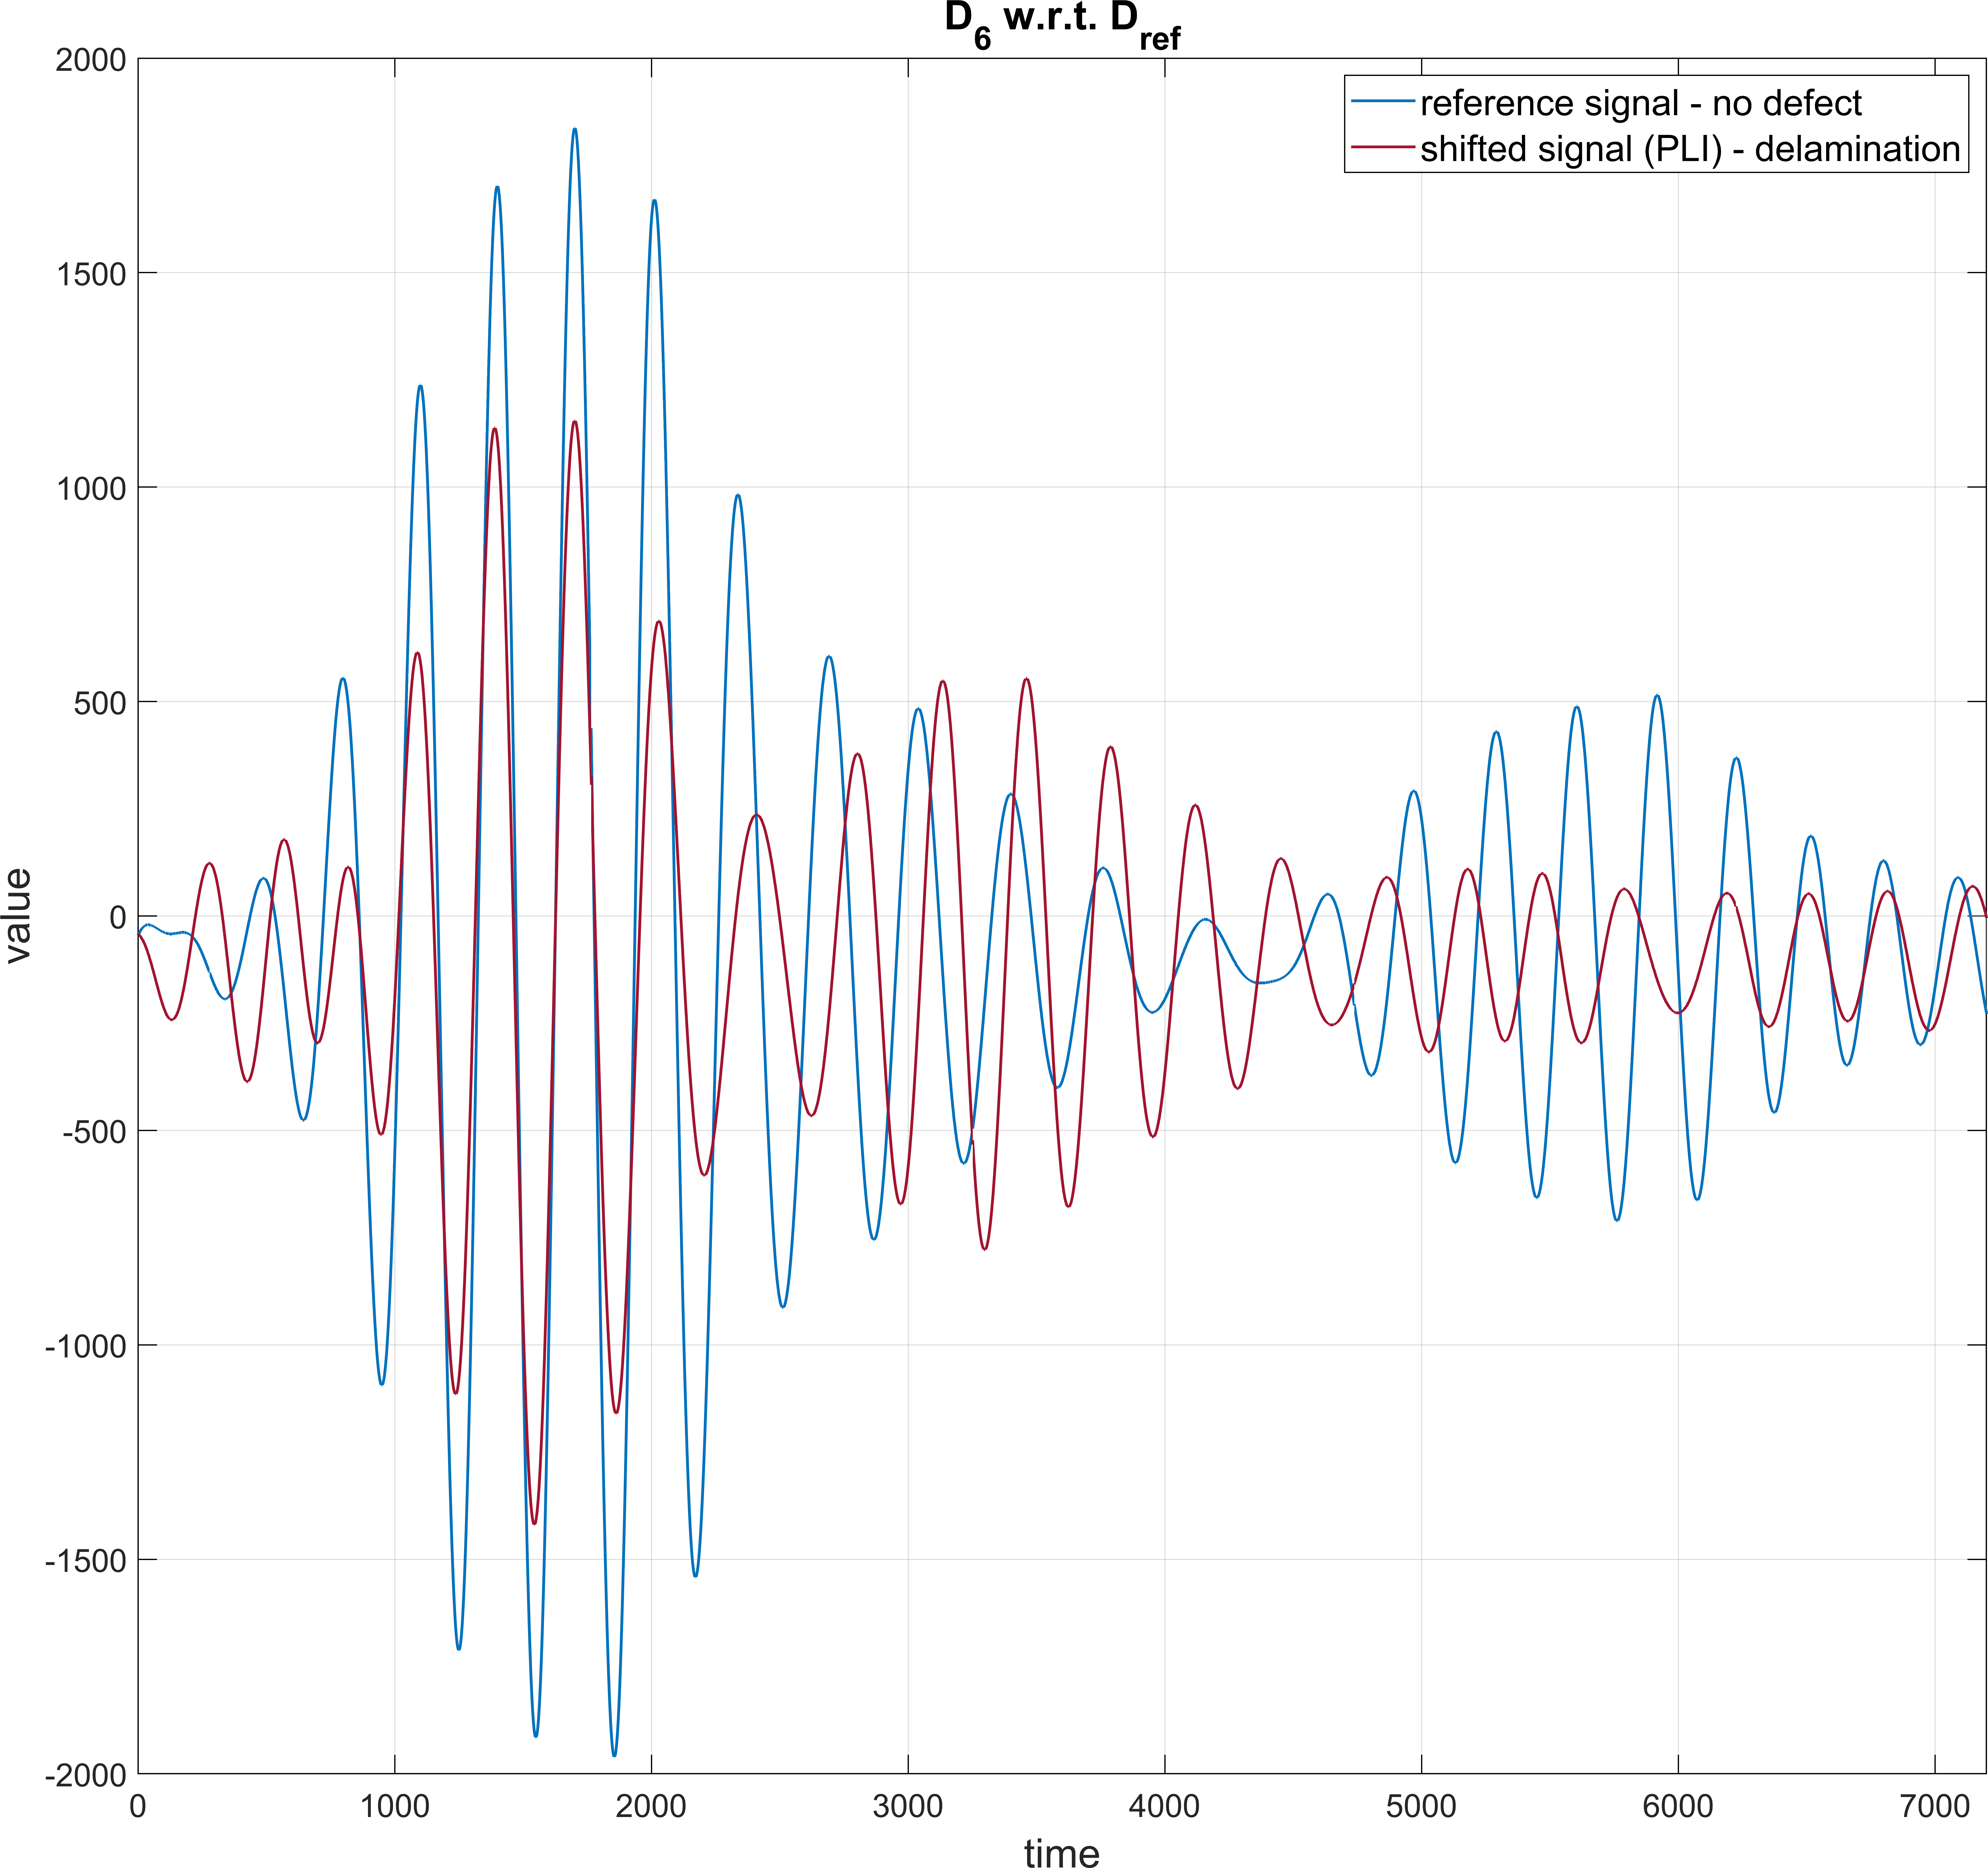
> Inaccurate result of SHM analysis due to used PLI interpolation.
The correct determination of the global maximum or the shift of the signal from the reference is
absolutely crucial for this ultrasonic SHM analysis. If an error occurs,
it is then easy to draw bad conclusions from the resulting graphs. Therefore, it is necessary to choose
interpolation method CSI and set the necessary parameters correctly. PLI and ECI methods
they are for comparison and experimentation only.
The time on the x-axis corresponds to the propagation of the wave through the surface of the material from point A to point B. If
we proceeded correctly, we have a reference wave (material without
defects) and the tested wool (delamination material). In addition, we have both waves compared
according to the global envelope maximum. This allows us to determine if and where it occurred
to delamination of the composite material, because we know that the acoustic signal propagates
at different speeds depending on the thickness of the material. Longitudinal propagation speed
waves in solids depends on the ratio of wavelength and environmental dimensions. In practice
it would still be necessary to compensate for the effect of temperature. Damaged (thinner)
material, the wave will run faster. In *FIG. 7* we can see delaminated
(red) and reference (blue) sample. To determine a specific value
delamination, we would need to know more data, at least the type of material and
test wave frequency.
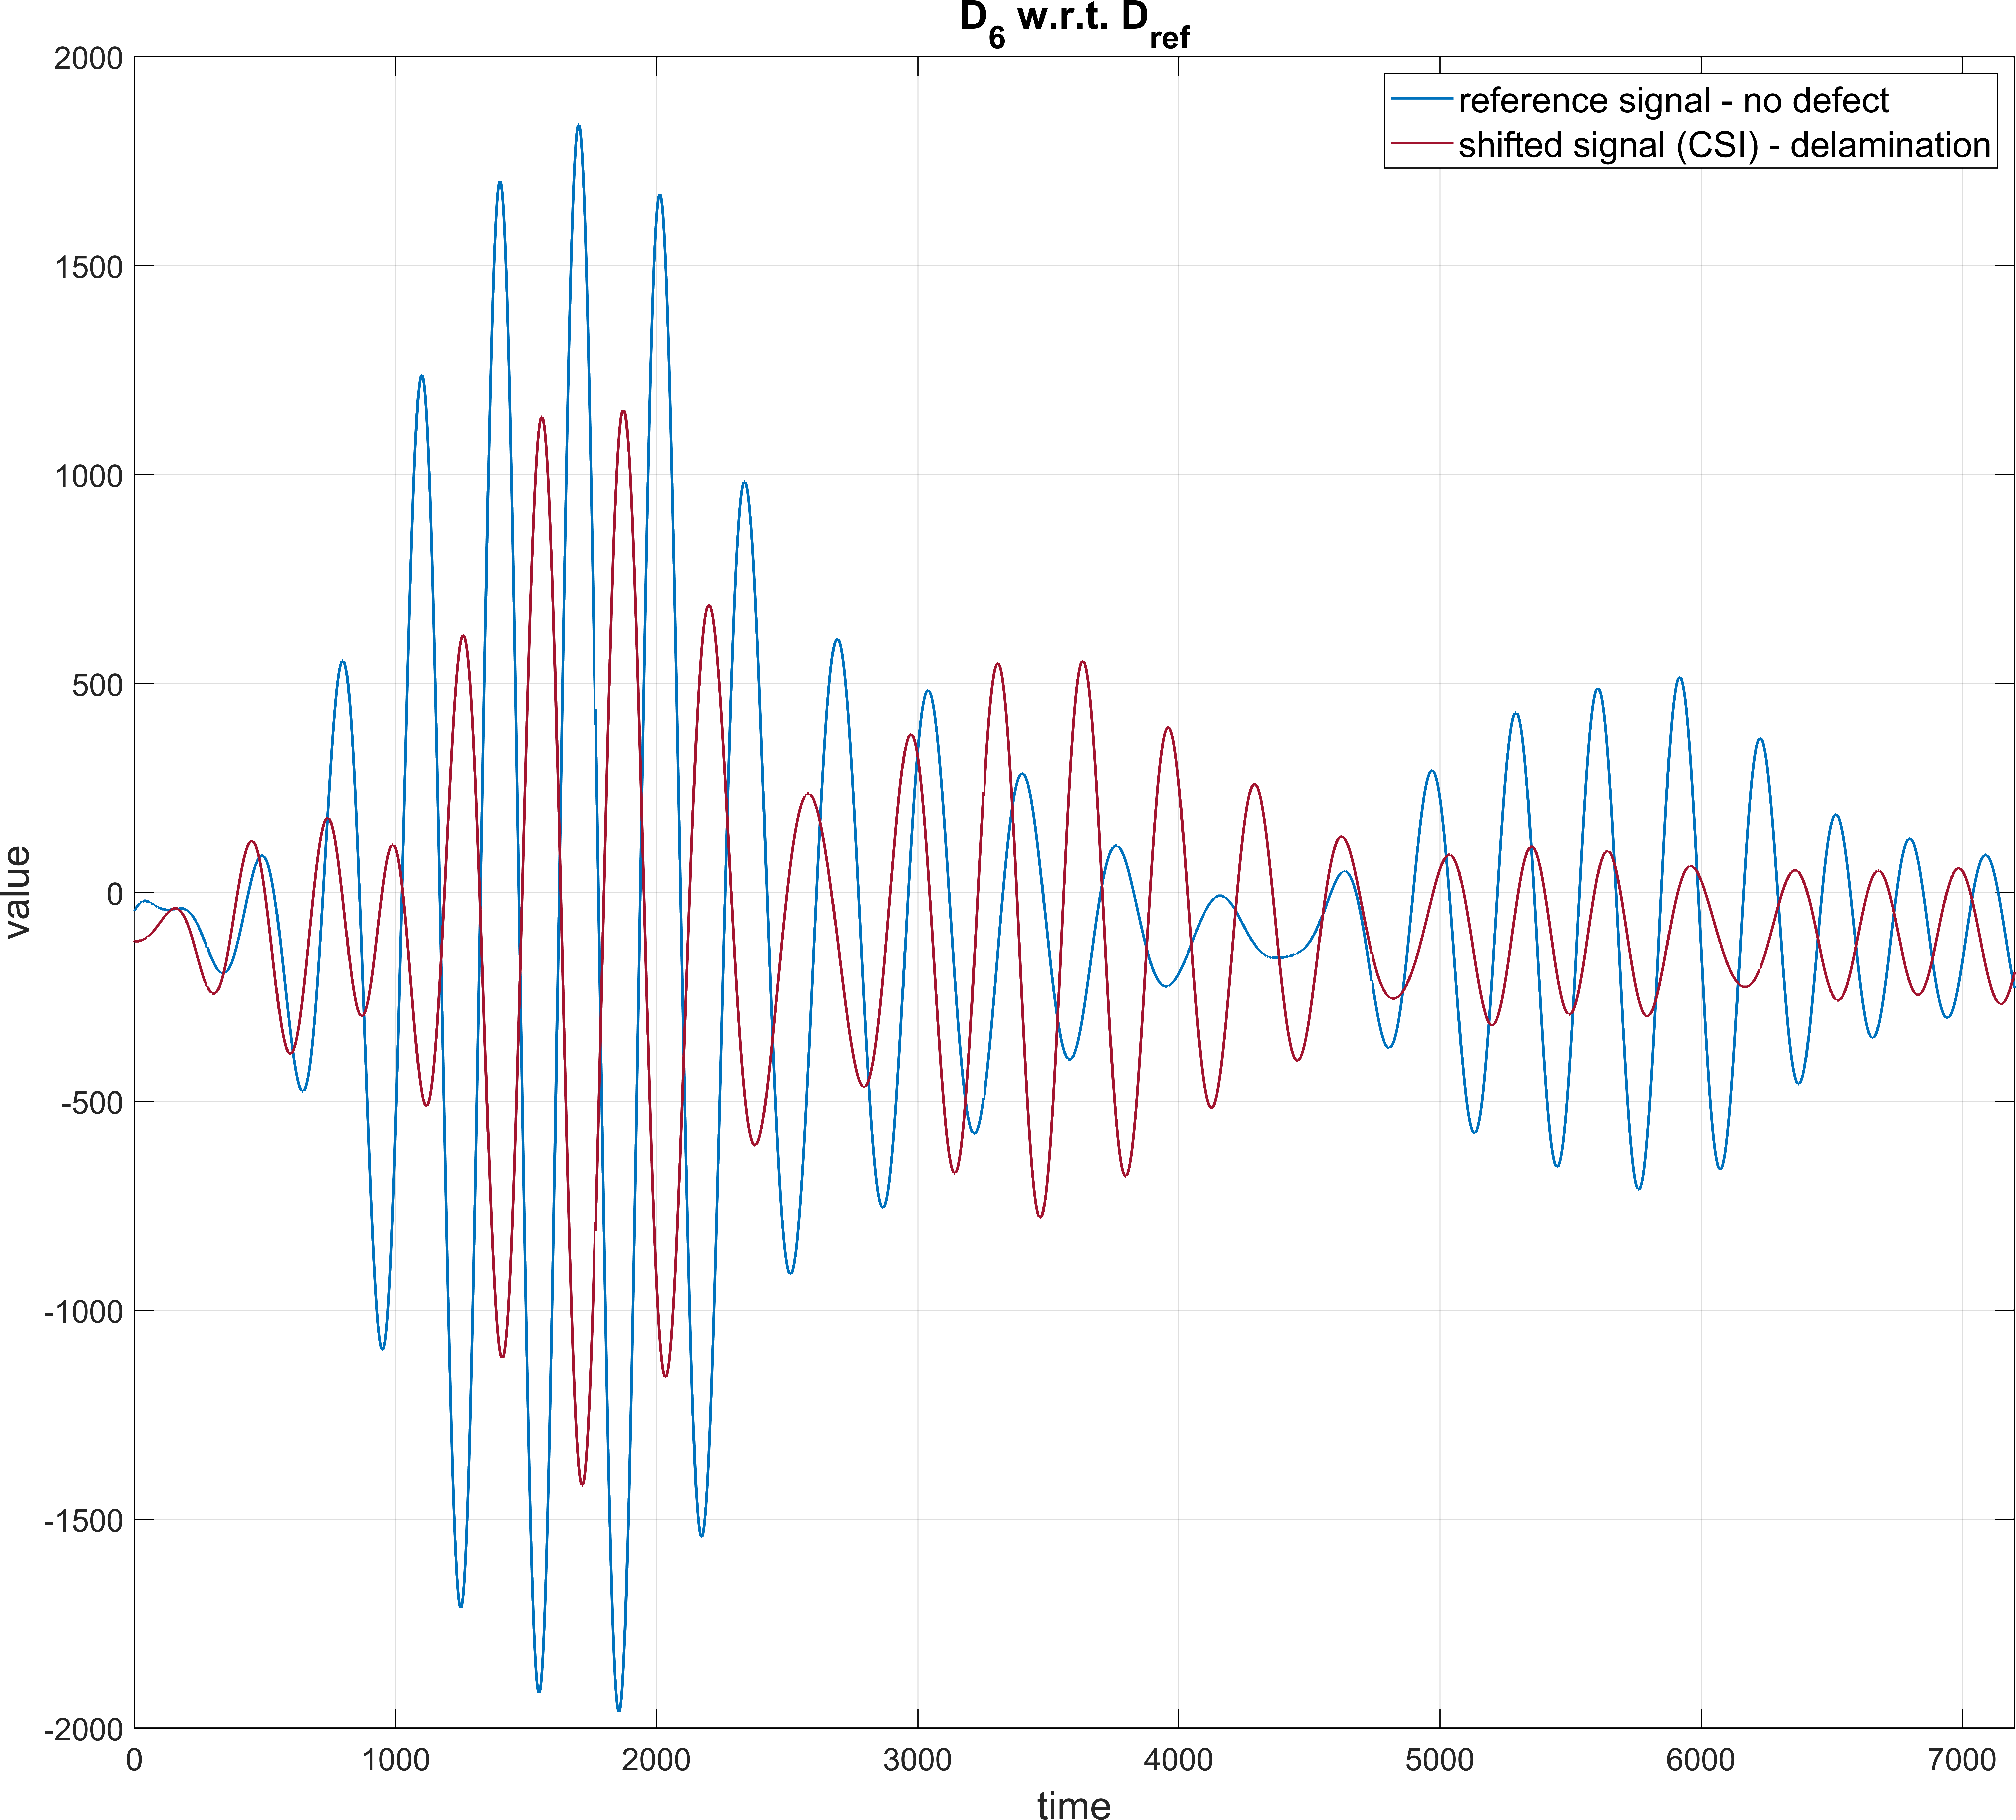
> Result of SHM analysis with used CSI interpolation. Shift tested red
waves against the reference blue indicates delamination of the composite material.
## 9. Conclusion
Ultrasonic SHM is one of the modern techniques with considerable potential for testing composite materials and detecting structural defects. There are many ways to align the reference and test sample. It would be interesting to compare the results of this method with, for example, the Hilbert transform or low-pass filtering. Cubic interpolation, or rather its global maximum, is, in my opinion, a quality and fast method that would definitely not lag behind others.
-------------------------------------------------- -------------------------------------------------- -------------------------------------------------- -------------------------------------------------- -------------------------------------------------- -------------------------------------------------- -------------------------------------------------- -------------------------------------------------- -------------------------------------------------- ---------------------------------------
The developed library is usable for *offline* ultrasonic SHM testing, is
however, it is necessary to use the CSI method with at least 10 interpolation modes. Pro *online*
testing, it is necessary to implement the last step, which is indicated in this work
in the MATLAB environment. After subtracting the displacement from the tested wave, subtract the resulting wave
wave from the reference signal. The difference symbolizes a change in transit time
waves through material with an anomaly and can be converted to millimeters, for example.
## 10. References
1. L. Michalcová and R. Hron, "Quantitative Evaluation of Delamination in
Composites Using Lamb Waves ", IOP Conference Series: Materials Science and
Engineering, vol 326, pp. 012006, 2018. Available:
10.1088 / 1757-899x / 326/1/012006 [Accessed 16 June 2020].
2. "Ultrasonic Testing", Nde-ed.org, 2020. [Online]. Available:
www.nde-ed.org/EducationResources/CommunityCollege/Ultrasonics/. [Accessed:
16- Jun- 2020].
3. J. Šplíchal and J. Hlinka, "Modeling of health monitoring signals and
detection areas for aerospace structures ", 13th Research and Education in
Aircraft Design: Conference proceedings, 2019. Available:
10.13164 / conf.read.2018.17 [Accessed 16 June 2020].
4. Y. Yang, Signal Theoretic Approach for Envelope Analysis of Real-Valued
Signals ", IEEE Access, vol. 5, pp. 5623-5630, 2017. Available:
10.1109 / access.2017.2688467.
5. E. Tarpara and V. Patankar, "Real time implementation of empirical mode
decomposition algorithm for ultrasonic nondestructive testing applications ",
Review of Scientific Instruments, vol. 89, no. 12, pp. 125118, 2018.
Available: 10.1063 / 1.5074152.
6. Z. Liu and Z. Zhang, The Improved Algorithm of the EMD Decomposition Based
on Cubic Spline Interpolation ", Signal Processing Research, vol. 4, no. 0,
pp. 63, 2015. Available: 10.14355 / spr.2015.04.011.