https://github.com/performancecopilot/grafana-pcp
Performance Co-Pilot Grafana Plugin
https://github.com/performancecopilot/grafana-pcp
Last synced: about 1 year ago
JSON representation
Performance Co-Pilot Grafana Plugin
- Host: GitHub
- URL: https://github.com/performancecopilot/grafana-pcp
- Owner: performancecopilot
- License: apache-2.0
- Created: 2019-03-12T22:04:20.000Z (over 7 years ago)
- Default Branch: main
- Last Pushed: 2025-02-27T20:09:09.000Z (over 1 year ago)
- Last Synced: 2025-05-16T12:11:39.242Z (about 1 year ago)
- Language: TypeScript
- Homepage: https://grafana-pcp.readthedocs.io
- Size: 9.63 MB
- Stars: 122
- Watchers: 15
- Forks: 20
- Open Issues: 15
-
Metadata Files:
- Readme: README.md
- Changelog: CHANGELOG.md
- Funding: .github/FUNDING.yml
- License: LICENSE
Awesome Lists containing this project
README
# Performance Co-Pilot Grafana Plugin
[](https://github.com/performancecopilot/grafana-pcp/actions?query=workflow:CI)
[](https://grafana-pcp.readthedocs.io/en/latest/?badge=latest)
[Performance Co-Pilot (PCP)](https://pcp.io) provides a framework and services to support system-level performance monitoring and management.
It presents a unifying abstraction for all of the performance data in a system, and many tools for interrogating, retrieving and processing that data.
[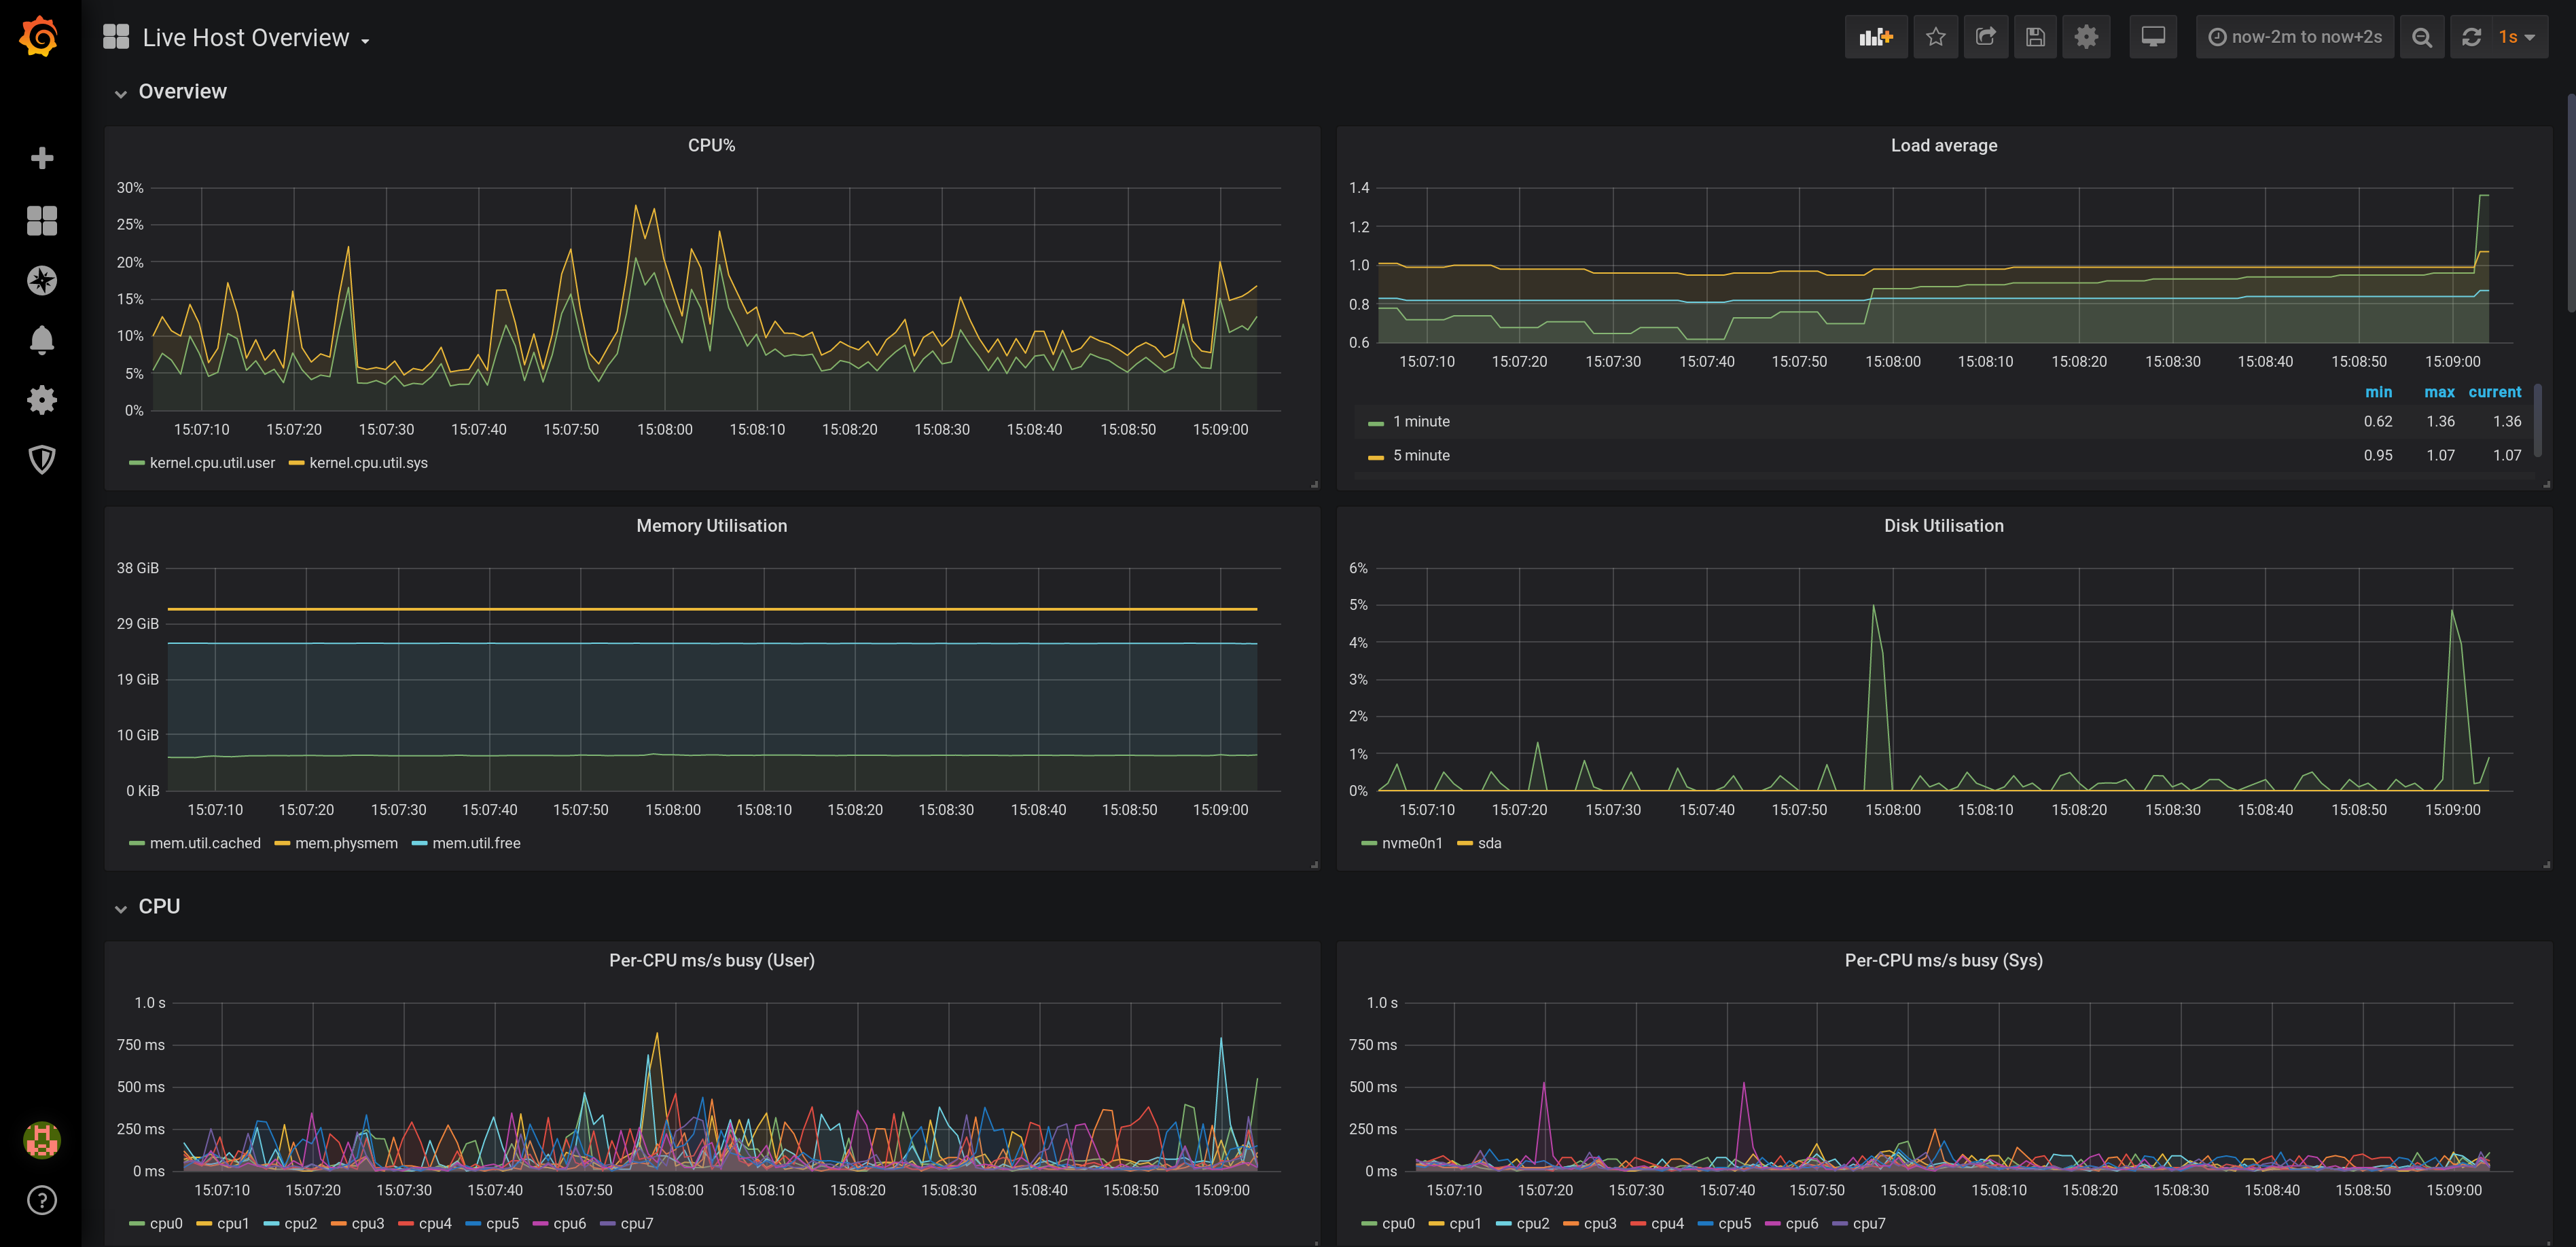](https://raw.githubusercontent.com/performancecopilot/grafana-pcp/main/src/img/screenshots/vector-overview.png)
[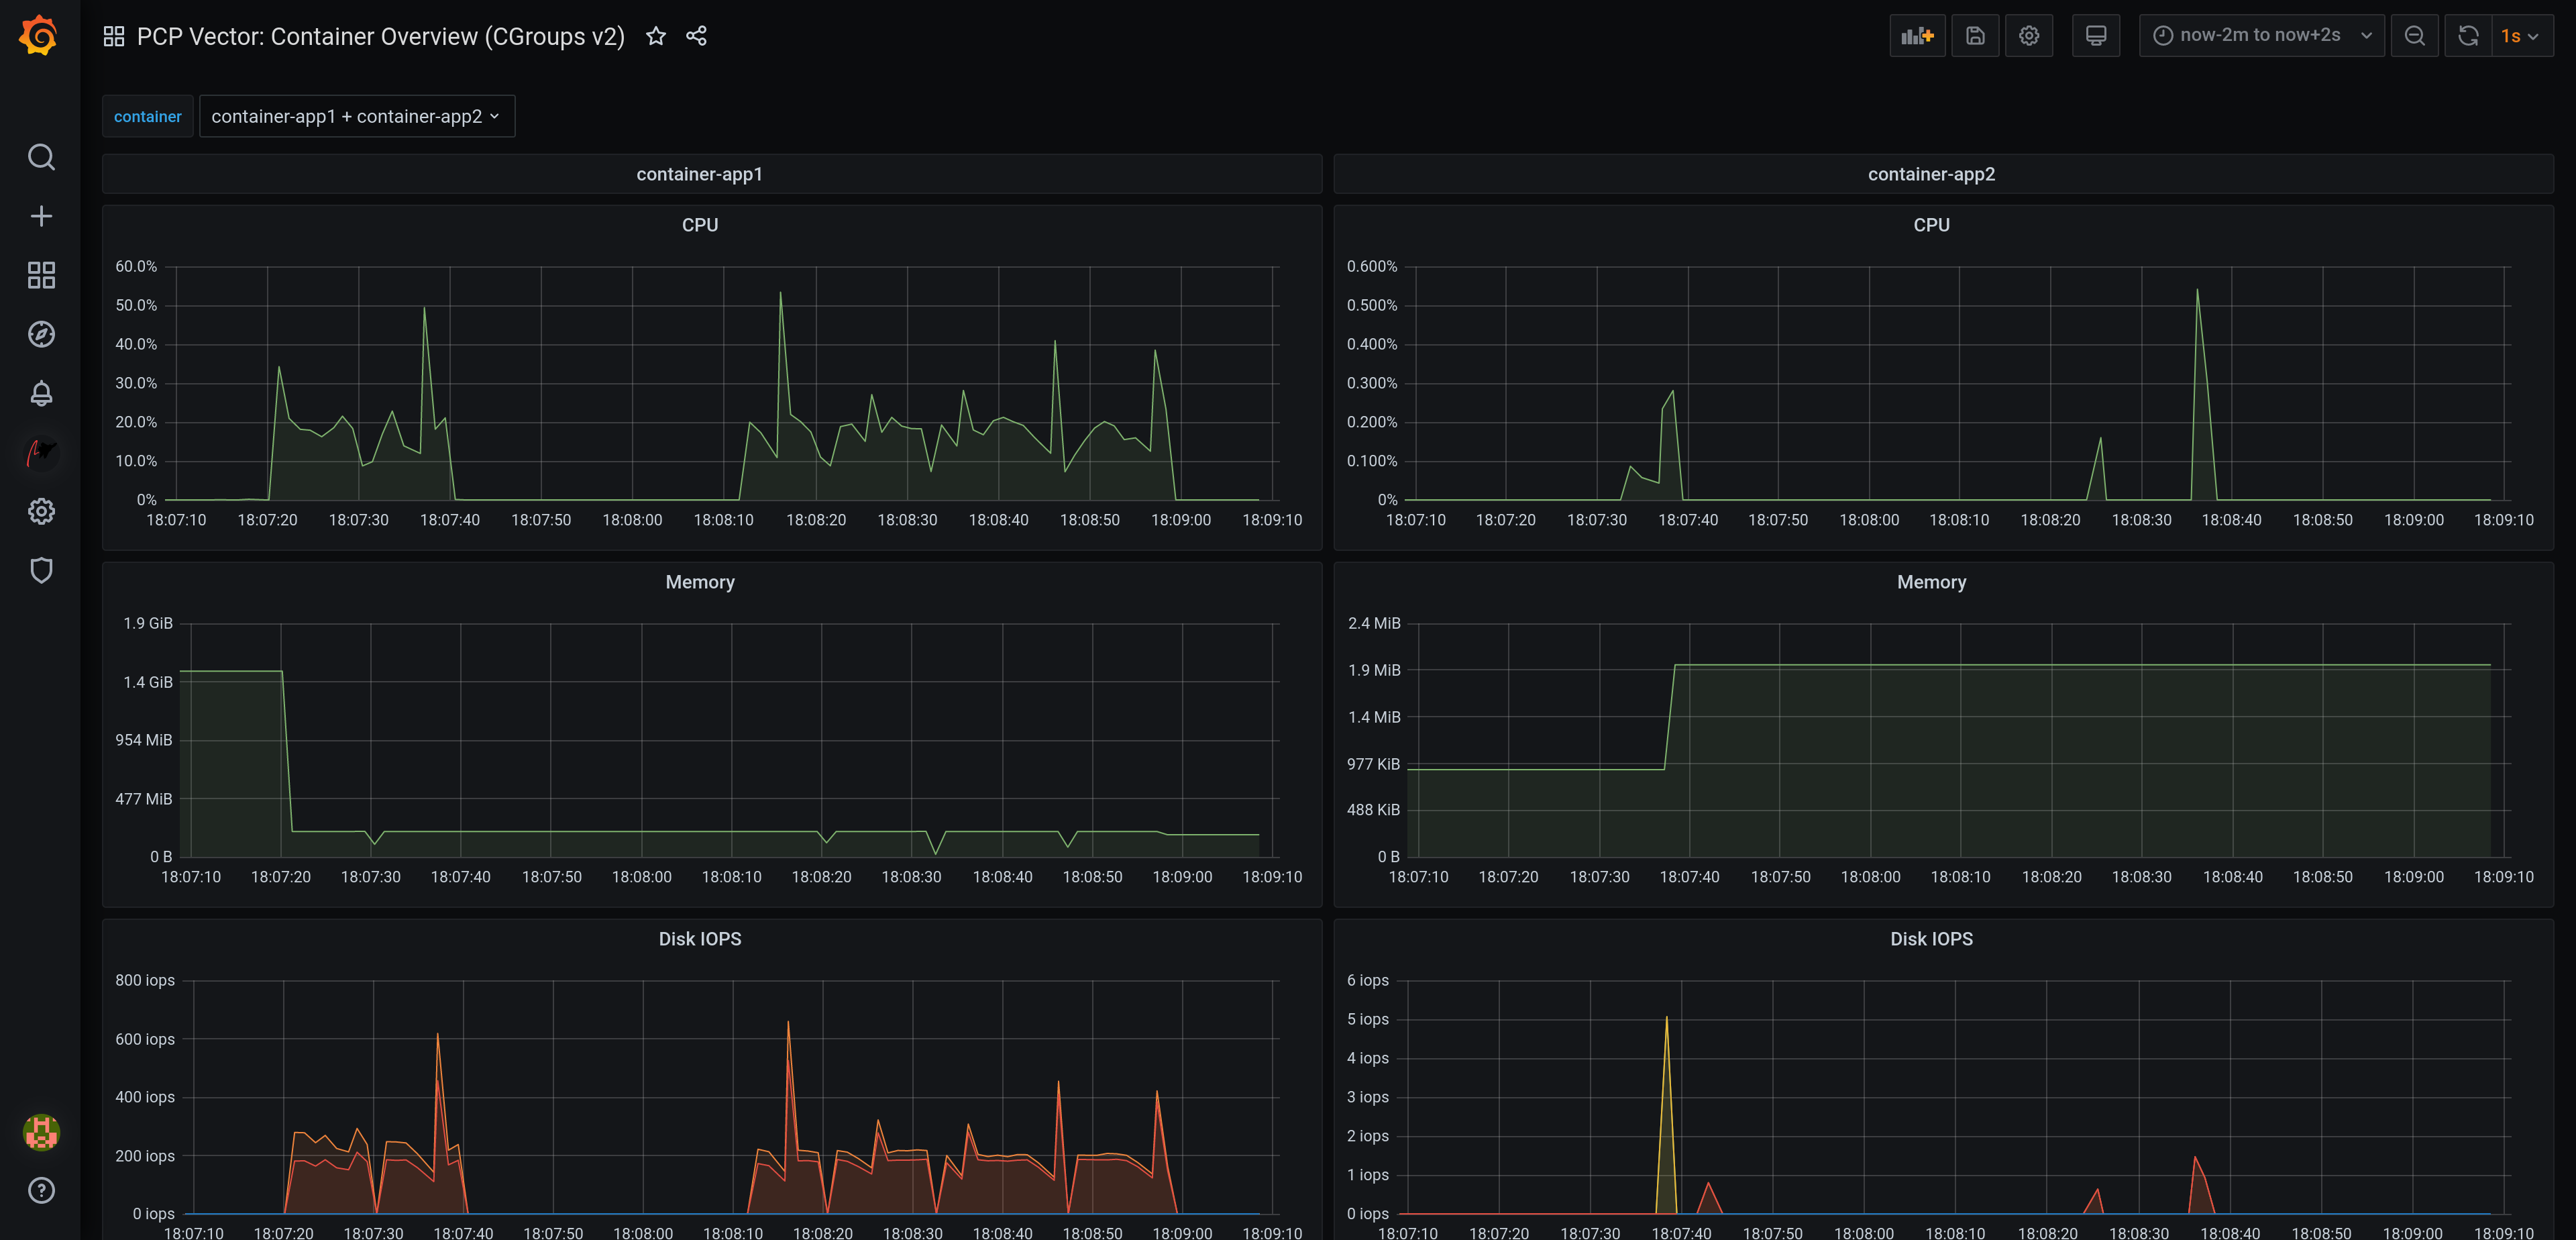](https://raw.githubusercontent.com/performancecopilot/grafana-pcp/main/src/img/screenshots/vector-containers.png)
[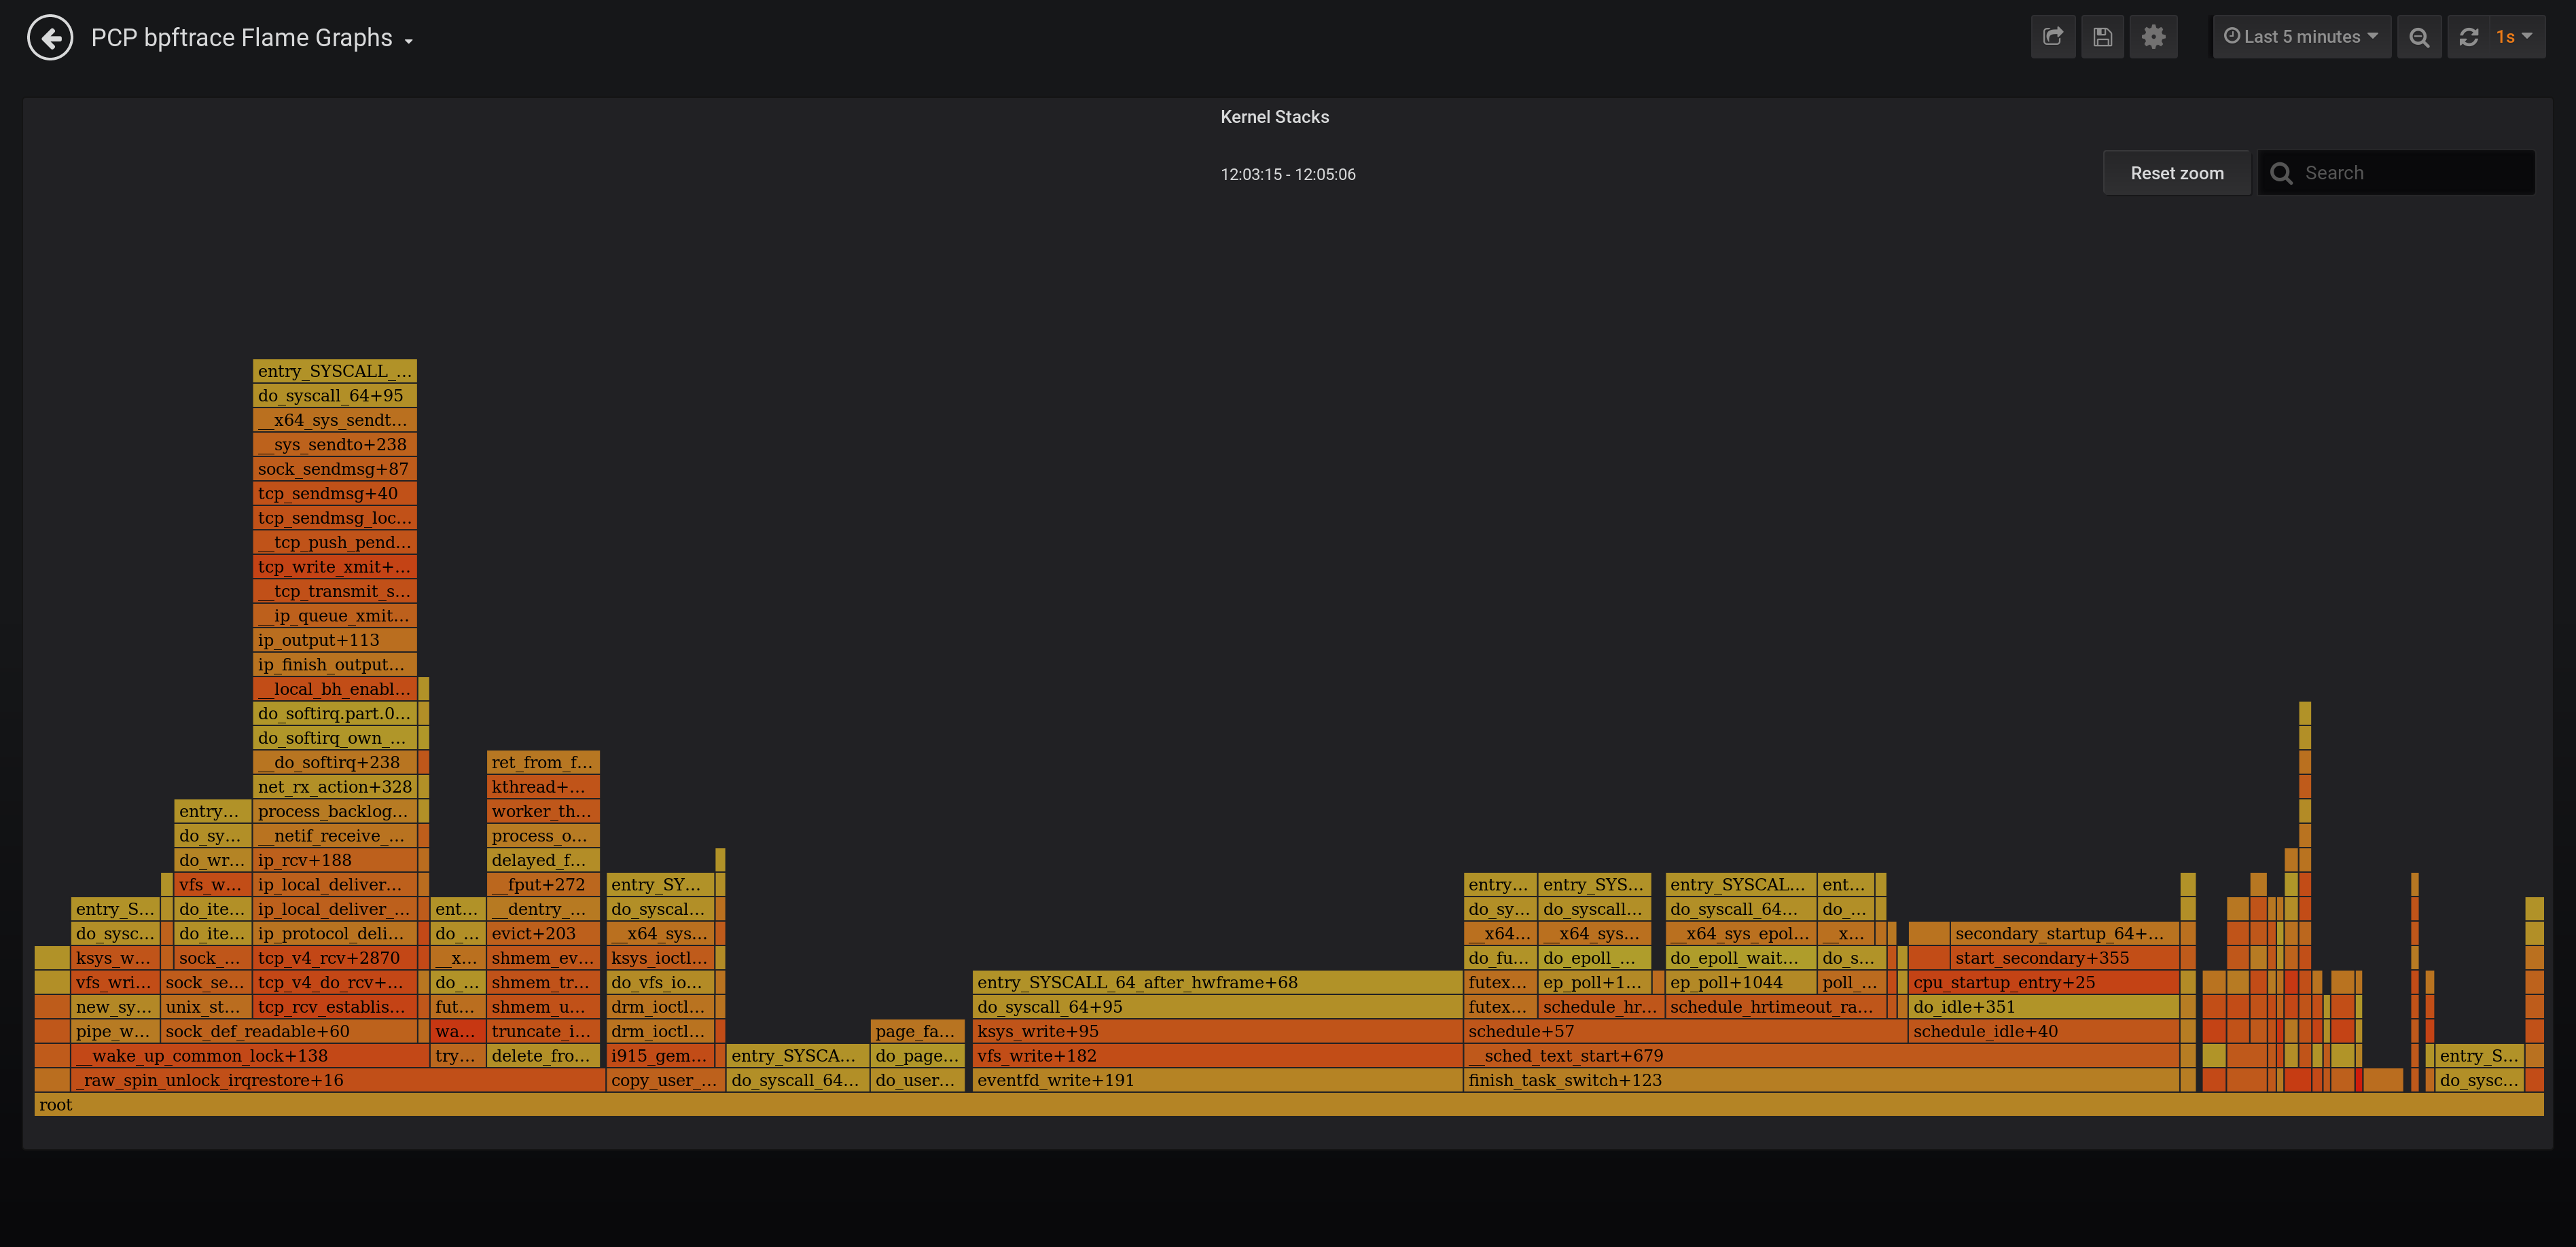](https://raw.githubusercontent.com/performancecopilot/grafana-pcp/main/src/img/screenshots/bpftrace-flame-graph.png)
[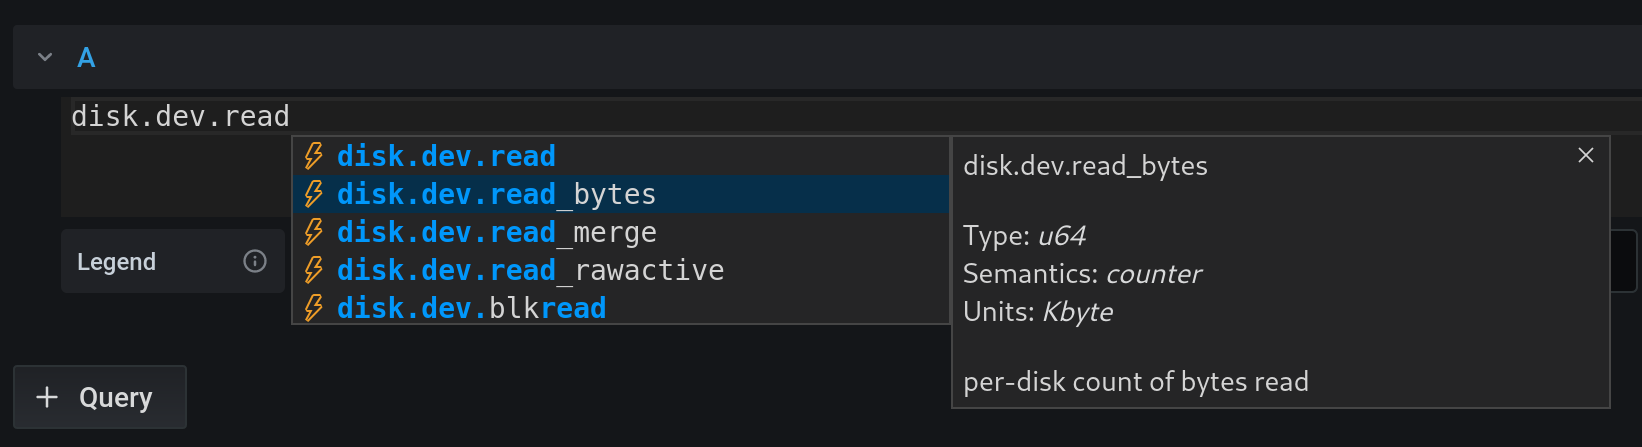](https://raw.githubusercontent.com/performancecopilot/grafana-pcp/main/src/img/screenshots/vector-metric-autocompletion.png)
[more screenshots](https://github.com/performancecopilot/grafana-pcp/tree/main/src/img/screenshots)
## Features
* analysis of historical PCP metrics using [pmseries](https://man7.org/linux/man-pages/man1/pmseries.1.html) query language
* analysis of real-time PCP metrics using [pmwebapi](https://man7.org/linux/man-pages/man3/pmwebapi.3.html) live services
* enhanced Berkeley Packet Filter (eBPF) tracing using [bpftrace](https://github.com/iovisor/bpftrace/blob/master/README.md) scripts
* dashboards for detecting potential performance issues and showing possible solutions using the Utilization Saturation and Errors (USE) method [2]
* full-text search in metric names, descriptions, instances [1]
* support for [Grafana Alerting](https://grafana.com/docs/grafana/latest/alerting/) [1]
* support for [derived metrics](https://man7.org/linux/man-pages/man3/pmregisterderived.3.html#DESCRIPTION) (allows the usage of arithmetic operators and statistical functions inside a query) [2]
* automated configuration of metric units [1,2,3]
* automatic rate and time utilization conversion
* heatmap, table [2,3] and flame graph [3] support
* auto completion of metric names [1,2], qualifier keys and values [1], and bpftrace probes, builtin variables and functions [3]
* display of semantics, units and help texts of metrics [2] and bpftrace builtins [3]
* legend templating support with `$metric`, `$metric0`, `$instance`, `$some_label`, `$some_dashboard_variable`
* container support [1,2]
* support for custom endpoint and hostspec per panel [2,3]
* support for repeated panels
* sample dashboards for all data sources
[1] PCP Valkey
[2] PCP Vector
[3] PCP bpftrace
## [Installation Instructions](https://grafana-pcp.readthedocs.io/en/latest/installation.html)
## [Documentation](https://grafana-pcp.readthedocs.io)