https://github.com/peschuster/logmonitor
Monitoring log files on windows systems.
https://github.com/peschuster/logmonitor
daemon graphite logs metrics monitoring service statsd
Last synced: 9 months ago
JSON representation
Monitoring log files on windows systems.
- Host: GitHub
- URL: https://github.com/peschuster/logmonitor
- Owner: peschuster
- License: mit
- Created: 2012-04-05T15:02:42.000Z (about 14 years ago)
- Default Branch: master
- Last Pushed: 2016-10-18T17:49:45.000Z (over 9 years ago)
- Last Synced: 2023-03-20T15:16:17.009Z (about 3 years ago)
- Topics: daemon, graphite, logs, metrics, monitoring, service, statsd
- Language: C#
- Homepage:
- Size: 4.6 MB
- Stars: 23
- Watchers: 4
- Forks: 18
- Open Issues: 0
-
Metadata Files:
- Readme: README.md
- License: LICENSE.md
Awesome Lists containing this project
README
# LogMonitor
*LogMonitor* is a combination of *logtail* and [*logster*](https://github.com/etsy/logster), but specifically designed for windows systems. It watches directories or files for changes, extracts metrics from the added content and submits these metrics to a configured backend (*graphite*, *statsd* or *console*).
Extracting metrics from added content is done by *PowerShell* scripts, which can be created or customized at will.
## Documentation
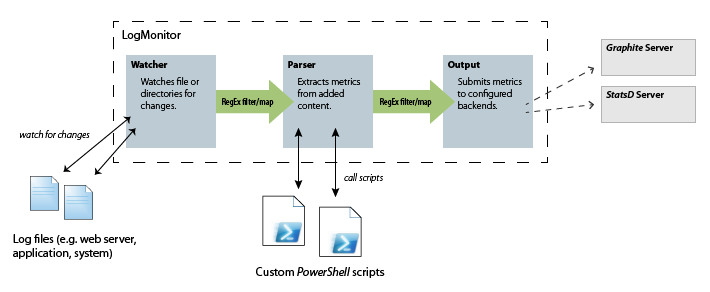
*LogMonitor* consists of three components:
1. Watching files or directories for changes.
2. Parsing added content.
3. Submitting metrics to backends.
Every component can be configured seperately and plugged together at will. Therefore you could e.g. watch two directories for changes, process all changes through the same parsers, but submit changes of the directories to seperat backends. *Mapping* between the components is always performed by regular expressions on the file names of the read changes.
## Running *LogMonitor*
*LogMonitor* can run in a console window (simply start `LogMonitor.exe`) or as a windows service.
To install *LogMonitor* as a Windows Service execute the following command:
C:\Windows\Microsoft.NET\Framework\v4.0.30319\installutil.exe LogMonitor.exe
And start the *LogMonitor* service with the command
net start LogMonitor
## Configuration
Configuration is done completely through the `App.config` (i.e. `LogMonitor.config`) file. An example is available at [source/LogMonitor/App.config](https://github.com/peschuster/LogMonitor/blob/master/source/LogMonitor/App.config)
Add the configuration section to your `app.config` file:
### Watched directories
**Options:**
* `path` - Path to a directory or file.
* `filter` - *[optional]*, default: "*". Filter for watched files in directory.
* `type` - *[optional]*, if `w3c` all lines are split in respective fields. Powershell scripts are provided with an `W3CChange` object.
* `maxDaysInactive` - *[optional]*, default: -1. If set, only files with activity during the last `x` days (configured value) are watched for changes.
* `bufferTime` - *[optional]*, default: 500. Time (in ms) for which events by the file system are buffered (i.e. aggregated) before processing.
* `intervalTime` - *[optional]*, default: 5000. Interval (in ms) of manual checks for changed files (in case file system raised no events).
### Parser for metrics
**Options:**
* `scriptPath` - Path to *PowerShell* script.
* `pattern` - RegEx pattern applied to log file names, to map parsers to specific files, file types or locations.
### Output backends
**Options:**
* `pathPattern` - RegEx pattern applied to log file names, to map output backends to specific files, file types or locations.
* `type` - RegEx pattern to filter metrics by type.
* `target` - Name of the backend (`graphite`, `statsd` or `console`).
* `metricsPrefix` - Prefix applied to all metrics, before sending them to the backend.
### Additional configuration
The *graphite* and *statsd* backends need extra configuration:
*LogMonitor* uses the graphite base library for these backends: [Graphite](https://github.com/peschuster/graphite-client)
To see/store log messages you can simply add a *trace listener* in your configuration:
## Writing *PowerShell* script parsers
A *PowerShell* script for extracting metrics from added lines must always contain a function with the following signature:
Function MetricProcessor ([LogMonitor.FileChange] $change)
{
}
It also must always return a list of `LogMonitor.Metric` objects. Objects of this type can be created by calling `[LogMonitor.Metric]::Create(..)`.
Here is an example for simply returning the number of added lines:
$metrics = @()
if ($change.GetType().FullName -eq "LogMonitor.Processors.W3CChange")
{
$metrics += [LogMonitor.Metric]::Create('calls', $change.Values.Count, [LogMonitor.MetricType]::Counter)
}
return $metrics
This example also checks for the type `LogMonitor.Processors.W3CChange` which is passed to the *PowerShell* script for log files of type `w3c`.
## Planned features
- Command line interface for reading historical data.
## Build
How to build *LogMonitor*:
1. Go to `\build\` directory
2. Execute `go.bat`