https://github.com/pgdr/benchmcmc
Benchmark analysis with MCMC
https://github.com/pgdr/benchmcmc
Last synced: 4 months ago
JSON representation
Benchmark analysis with MCMC
- Host: GitHub
- URL: https://github.com/pgdr/benchmcmc
- Owner: pgdr
- License: mit
- Created: 2020-10-22T11:37:01.000Z (over 4 years ago)
- Default Branch: main
- Last Pushed: 2020-12-07T10:14:26.000Z (over 4 years ago)
- Last Synced: 2025-03-07T11:43:04.977Z (4 months ago)
- Language: Python
- Size: 96.7 KB
- Stars: 1
- Watchers: 2
- Forks: 0
- Open Issues: 0
-
Metadata Files:
- Readme: README.md
- License: LICENSE
Awesome Lists containing this project
README
# benchmcmc — Benchmark analysis with MCMC
## Install
Installing is as always
```
pip install benchmcmc
```
It depends on [`pymc3`](https://pypi.org/project/pymc3/) and
[`matplotlib`](https://pypi.org/project/matplotlib/), so these are also
installed.
## Quickstart
Getting started real quick:
```
benchmcmc --generate 69 11 10 131 10 9 --beta > bench.txt
benchmcmc bench.txt
```
The first command generates 200 synthetic data points and put them into
`bench.txt`, and the second command runs `benchmcmc` on the data,
displaying a _trace plot_ of the MCMC.
## Introduction
This package lets you take a series of benchmark data analyses whether
there at one point was a change in performance.
Suppose that you run your benchmark tests on every commit that you have
(e.g. looping over `git-rev-list`),
and you see that your performance data
is (e.g. in requests per second or in seconds, or other measures)
as follows:
```
13.64
12.82
11.69
15.12
12.30
18.46
13.51
14.33
13.84
12.77
... (180 rows omitted)
10.93
11.02
12.45
11.78
12.12
13.51
10.66
10.18
10.81
12.19
```
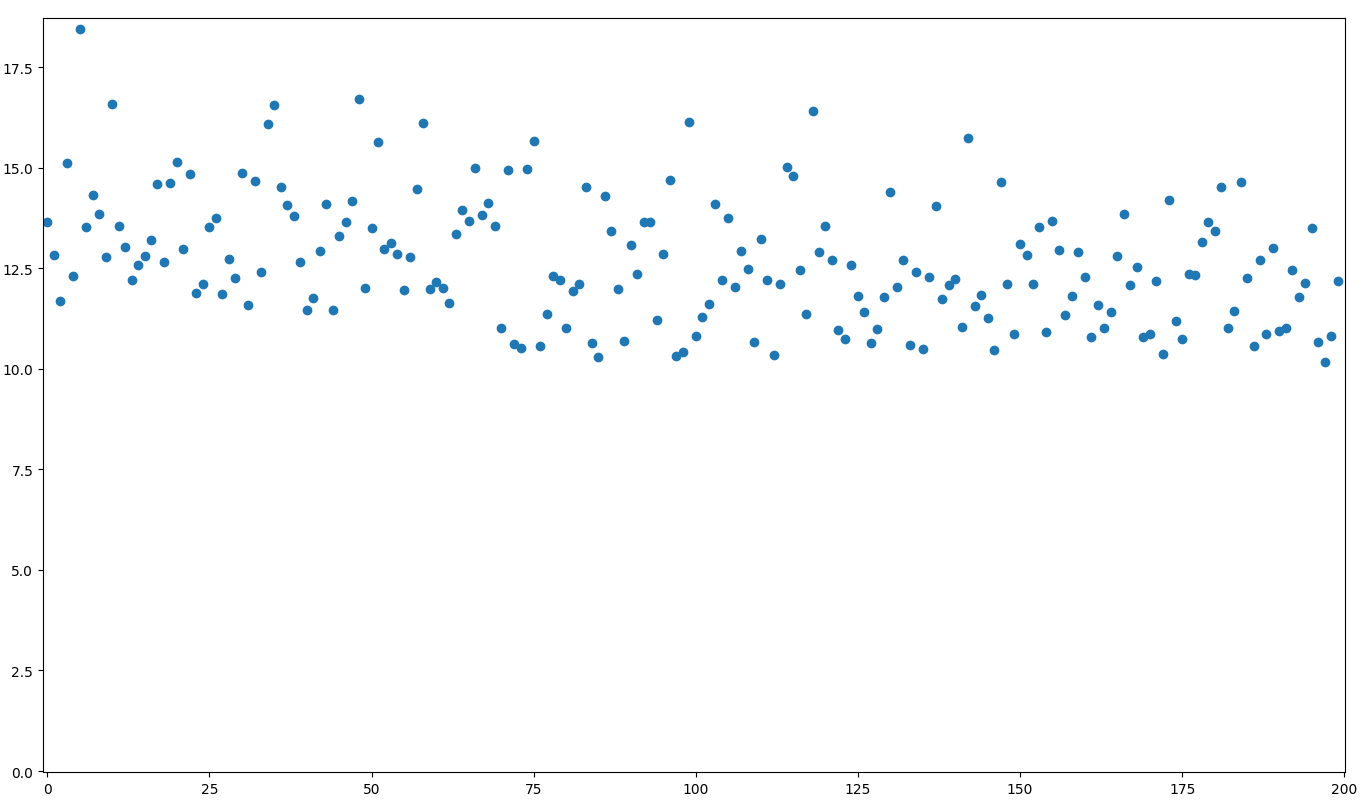
In this data, it seems to be centered around 13+ε in the beginning,
and it ends
being centered around 12+ε, or visualized:

There seems to be a slight drop in values before the 100th point, but
it's not easy to determine exactly where the change occurred.
Suppose that you wonder whether or not the performance at the start and
at the end are likely to be from two different distributions, and if so,
where the _switchpoint_ was.

## Analysis
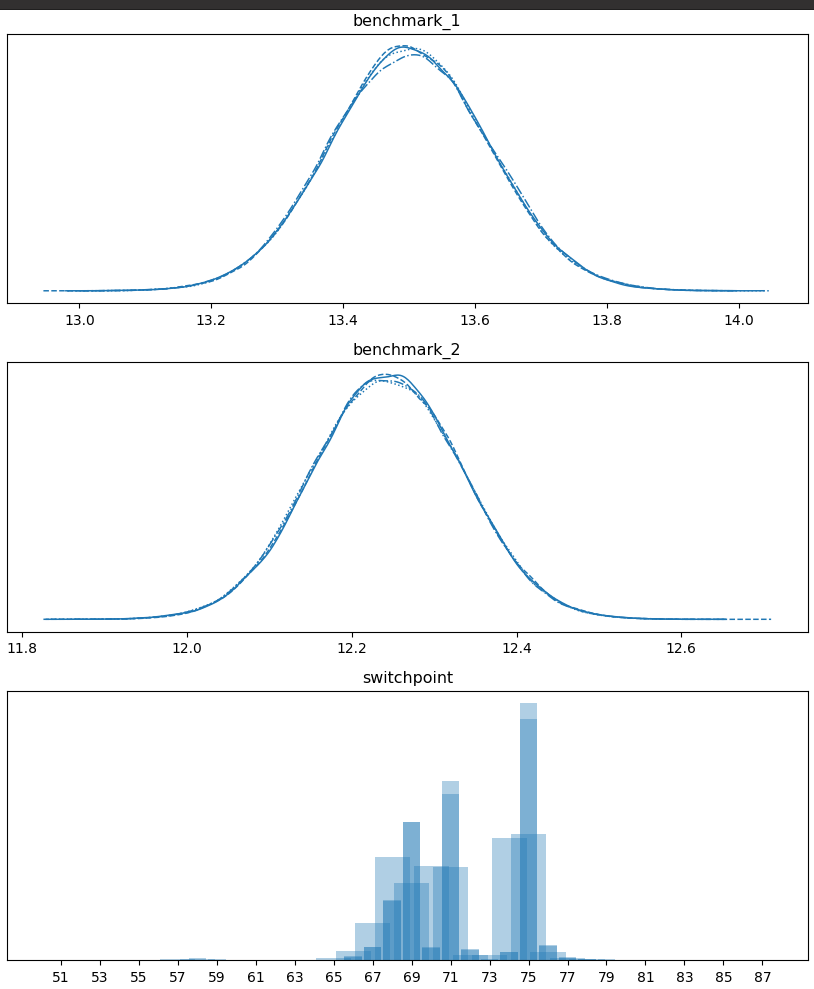
Running `benchmcmc` on the data gives the above plot which shows that it
is likely that the performance went from ~13.5 to ~12.25 at or around the
69th or 75th datapoints.
This helps you pin down when a performance change might have occurred.
## Usage
```
$ benchmcmc bench.txt --draws 1000 --tune 1000 --cores 4 --target-accept 0.8
```
The options available are those illustrated in the above examples and
all taken from and fed into
[`pymc3.sampling.sample`](https://docs.pymc.io/api/inference.html).
* `draws` — The number of samples to draw. Defaults to 1000. The number
of tuned samples are discarded by default.
* `tune` — Number of iterations to tune, defaults to 1000. Samplers
adjust the step sizes, scalings or similar during tuning. Tuning
samples will be drawn in addition to the number specified in the draws
argument, and will be discarded.
* `cores` — The number of _chains_ to run in parallel. If `None`, set
to the number of CPUs in the system, but at most 4.
* `target_accept` : float in [0, 1] — The step size is tuned such that
we approximate this acceptance rate. Higher values like 0.9 or 0.95
often work better for problematic posteriors.
---
## Generating synthetic data
You can run `benchmcmc --generate` for generating synthetic benchmark
data.
```bash
$ benchmcmc --generate 100 15 3 100 14 3 [--beta] > benchmarkfile.txt
```
This generates 200 samples, 100 from `N(mu=15, sigma=3)` followed by 100
from `N(mu=14, sigma=3)`.
If you use `--beta`, you get a bit more realistic performance with a
_lower bound_ of `mu`, especially for lower values of `mu`.
## Running a script on a history
Suppose that you want to run `python script.py` on a script that is in
your Git tree.
```bash
LOGFILE=/tmp/timescript
echo "" > $LOGFILE
for commit in $(git rev-list master)
do
git checkout $commit
printf "%s," "`(git rev-parse --short HEAD)`" >> $LOGFILE
/usr/bin/time -a -o $LOGFILE --format=%e python script.py
done
tac $LOGFILE
```
When run in a repository, it will output time data in the format
```
commit,time
```
Here is an example of the output:
```
484fde8,0.04
58a1cdb,0.04
d26b797,0.04
81f4b9a,0.04
3ae1e11,0.04
7689ca2,0.04
8c76b29,0.04
43db50c,0.04
b34b146,0.04
4c56a54,0.04
9c08050,0.07
b22278d,0.07
7a9c111,0.07
065b6a5,0.07
6cc7cdd,0.07
ec7f042,0.07
b3ba887,0.08
a32ce81,0.07
9136914,0.07
b456714,0.07
504cf73,0.07
8002774,0.07
e1f5f9f,0.09
```
---
For example, you can create a script `gitrun` that looks as follows:
```bash
#!/usr/bin/bash
GITRUN_EXEC=$1
shift
GITRUN_ARGS=$@
for commit in $(git rev-list master)
do
git checkout --quiet $commit
printf "%s," "`(git rev-parse --short HEAD)`"
sh -c "$GITRUN_EXEC $GITRUN_ARGS"
done
```