https://github.com/pgsentinel/pgsentinel
postgresql extension providing Active session history
https://github.com/pgsentinel/pgsentinel
ash database extension postgres postgresql postgresql-extension troubleshooting tuning
Last synced: 5 months ago
JSON representation
postgresql extension providing Active session history
- Host: GitHub
- URL: https://github.com/pgsentinel/pgsentinel
- Owner: pgsentinel
- License: postgresql
- Created: 2018-07-07T04:53:38.000Z (about 8 years ago)
- Default Branch: master
- Last Pushed: 2026-02-03T03:09:44.000Z (5 months ago)
- Last Synced: 2026-02-03T17:04:52.199Z (5 months ago)
- Topics: ash, database, extension, postgres, postgresql, postgresql-extension, troubleshooting, tuning
- Language: C
- Homepage:
- Size: 154 KB
- Stars: 187
- Watchers: 13
- Forks: 26
- Open Issues: 14
-
Metadata Files:
- Readme: README.md
- License: LICENSE
Awesome Lists containing this project
- jimsghstars - pgsentinel/pgsentinel - postgresql extension providing Active session history (C)
README
`pgsentinel` – sampling active session history
=============================================================
[](https://travis-ci.org/pgsentinel/pgsentinel)
Introduction
------------
PostgreSQL provides session activity. However, in order to gather activity
behavior, users have to sample the pg_stat_activity view multiple times.
`pgsentinel` is an extension to record active session history and link
the activity with query statistics (`pg_stat_statements`).
The module must be loaded by adding `pgsentinel` to
`shared_preload_libraries` in postgresql.conf, which means a server restart
is needed.
When `pgsentinel` is enabled, it collects the history of session activity:
* It's implemented as an in-memory ring buffer where
samples are written with a given (configurable)
period. Therefore, the user can see some number of
recent samples depending on the history size (configurable).
In combination with `pg_stat_statements`, this extension can link the session activity with
query statistics.
To get more granular queries statistics, `pgsentinel` samples the `pg_stat_statements` view:
* at the same time it is sampling the active sessions
* only for the queryid associated to an active session (if any) during the sampling
`pgsentinel` launches a special background worker for gathering session activities.
Availability
------------
`pgsentinel` is implemented as an extension and not available in the default
PostgreSQL installation. It is available from
[github](https://github.com/pgsentinel/pgsentinel)
under the same license as
[PostgreSQL License](https://github.com/pgsentinel/pgsentinel/blob/master/LICENSE)
and supports PostgreSQL 9.6+.
Installation
------------
`pgsentinel` is a PostgreSQL extension which requires PostgreSQL 9.6 or
higher. Before the build and install steps, you should ensure the following:
* PostgreSQL version is 9.6 or higher.
* You have the development package of PostgreSQL installed or you built
PostgreSQL from source.
* Your `PATH` variable configuration includes `pg_config`, or
you've set a value for `PG_CONFIG`.
The typical installation procedure may look like:
As `pgsentinel` uses the `pg_stat_statements` extension (officially bundled with PostgreSQL) for tracking which queries get executed in your database, add the following entries to your postgres.conf:
$ shared_preload_libraries = 'pg_stat_statements,pgsentinel'
$ # Increase the max size of the query strings Postgres records
$ track_activity_query_size = 2048
$ # Track statements generated by stored procedures as well
$ pg_stat_statements.track = all
restart the postgresql daemon and create the extension:
$ git clone https://github.com/pgsentinel/pgsentinel.git
$ cd pgsentinel/src
$ make
$ sudo make install
$ psql DB -c "CREATE EXTENSION pgsentinel;"
Usage
-----
`pgsentinel` reports the active session history activity through the `pg_active_session_history` view:
| Column | Type | Collation | Nullable | Default |
| ------------------ | -------------------------- | ----------- | ---------- | --------- |
| ash_time | timestamp with time zone | | | |
| datid | oid | | | |
| datname | text | | | |
| pid | integer | | | |
| leader_pid | integer | | | |
| usesysid | oid | | | |
| usename | text | | | |
| application_name | text | | | |
| client_addr | text | | | |
| client_hostname | text | | | |
| client_port | integer | | | |
| backend_start | timestamp with time zone | | | |
| xact_start | timestamp with time zone | | | |
| query_start | timestamp with time zone | | | |
| state_change | timestamp with time zone | | | |
| wait_event_type | text | | | |
| wait_event | text | | | |
| state | text | | | |
| backend_xid | xid | | | |
| backend_xmin | xid | | | |
| top_level_query | text | | | |
| query | text | | | |
| cmdtype | text | | | |
| queryid | bigint | | | |
| backend_type | text | | | |
| blockers | integer | | | |
| blockerpid | integer | | | |
| blocker_state | text | | | |
You can see it as samplings of `pg_stat_activity` providing more information:
* `ash_time`: the sampling time
* `top_level_query`: the top level statement (in case PL/pgSQL is used)
* `query`: the statement being executed (not normalised, as it is in `pg_stat_statements`, which means you see parameter values)
* `cmdtype`: the statement type (SELECT,UPDATE,INSERT,DELETE,UTILITY,UNKNOWN,NOTHING)
* `queryid`: the queryid of the statement which links to pg_stat_statements
* `blockers`: the number of blockers
* `blockerpid`: the pid of the blocker (if blockers = 1), the pid of one blocker (if blockers > 1)
* `blocker_state`: state of the blocker (state of the blockerpid)
`pgsentinel` also reports query statistics history through the `pg_stat_statements_history` view:
| Column | Type | Collation | Nullable | Default |
| ------------------ | -------------------------- | ----------- | ---------- | --------- |
| ash_time | timestamp with time zone | | | |
| userid | oid | | | |
| dbid | oid | | | |
| queryid | bigint | | | |
| calls | bigint | | | |
| total_exec_time | double precision | | | |
| rows | bigint | | | |
| shared_blks_hit | bigint | | | |
| shared_blks_read | bigint | | | |
| shared_blks_dirtied | bigint | | | |
| shared_blks_written | bigint | | | |
| local_blks_hit | bigint | | | |
| local_blks_read | bigint | | | |
| local_blks_dirtied | bigint | | | |
| local_blks_written | bigint | | | |
| temp_blks_read | bigint | | | |
| temp_blks_written | bigint | | | |
| blk_read_time | double precision | | | |
| blk_write_time | double precision | | | |
| plans | bigint | | | |
| total_plan_time | double precision | | | |
| wal_records | bigint | | | |
| wal_fpi | bigint | | | |
| wal_bytes | numeric | | | |
The field descriptions are the same as for `pg_stat_statements` (except for the `ash_time` one, which is the time of the active session history sampling).
The worker is controlled by the following GUCs:
| Parameter name | Data type | Description | Default value | Min value |
| ----------------------------------- | --------- | ------------------------------------------- | ------------ | -------- |
| pgsentinel_ash.sampling_period | int4 | Period for history sampling in seconds | 1 | 1 |
| pgsentinel_ash.max_entries | int4 | Size of pg_active_session_history in-memory ring buffer | 1000 | 1000 |
| pgsentinel.db_name | char | database the worker should connect to | postgres | |
| pgsentinel_ash.track_idle_trans | boolean | track session in idle in transaction state | false | |
| pgsentinel_pgssh.max_entries | int4 | Size of pg_stat_statements_history in-memory ring buffer | 1000 | 1000 |
| pgsentinel_pgssh.enable | boolean | enable pg_stat_statements_history | false | |
Remark
-------------------------
* Some fields may be NULL depending on the version (for example, `leader_pid` is NULL for version <= 13.0...)
See how to query the view in this short video
-------------
[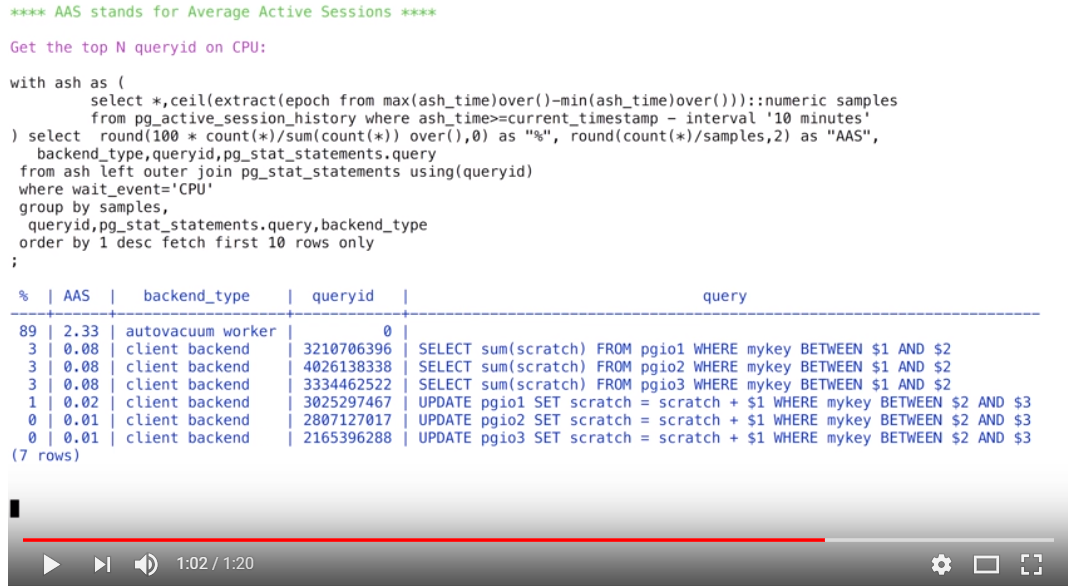](https://www.youtube.com/watch?v=WVKzKjlK75U)
### The videos are available on [youtube](https://www.youtube.com/channel/UCGVciSS2YwnPhtHHGB3Ep3A)
Contribution
------------
If you're lacking some functionality in `pgsentinel` then you're welcome to make pull requests.
Author
-------
* Bertrand Drouvot ,
France, [Twitter](https://twitter.com/BertrandDrouvot)