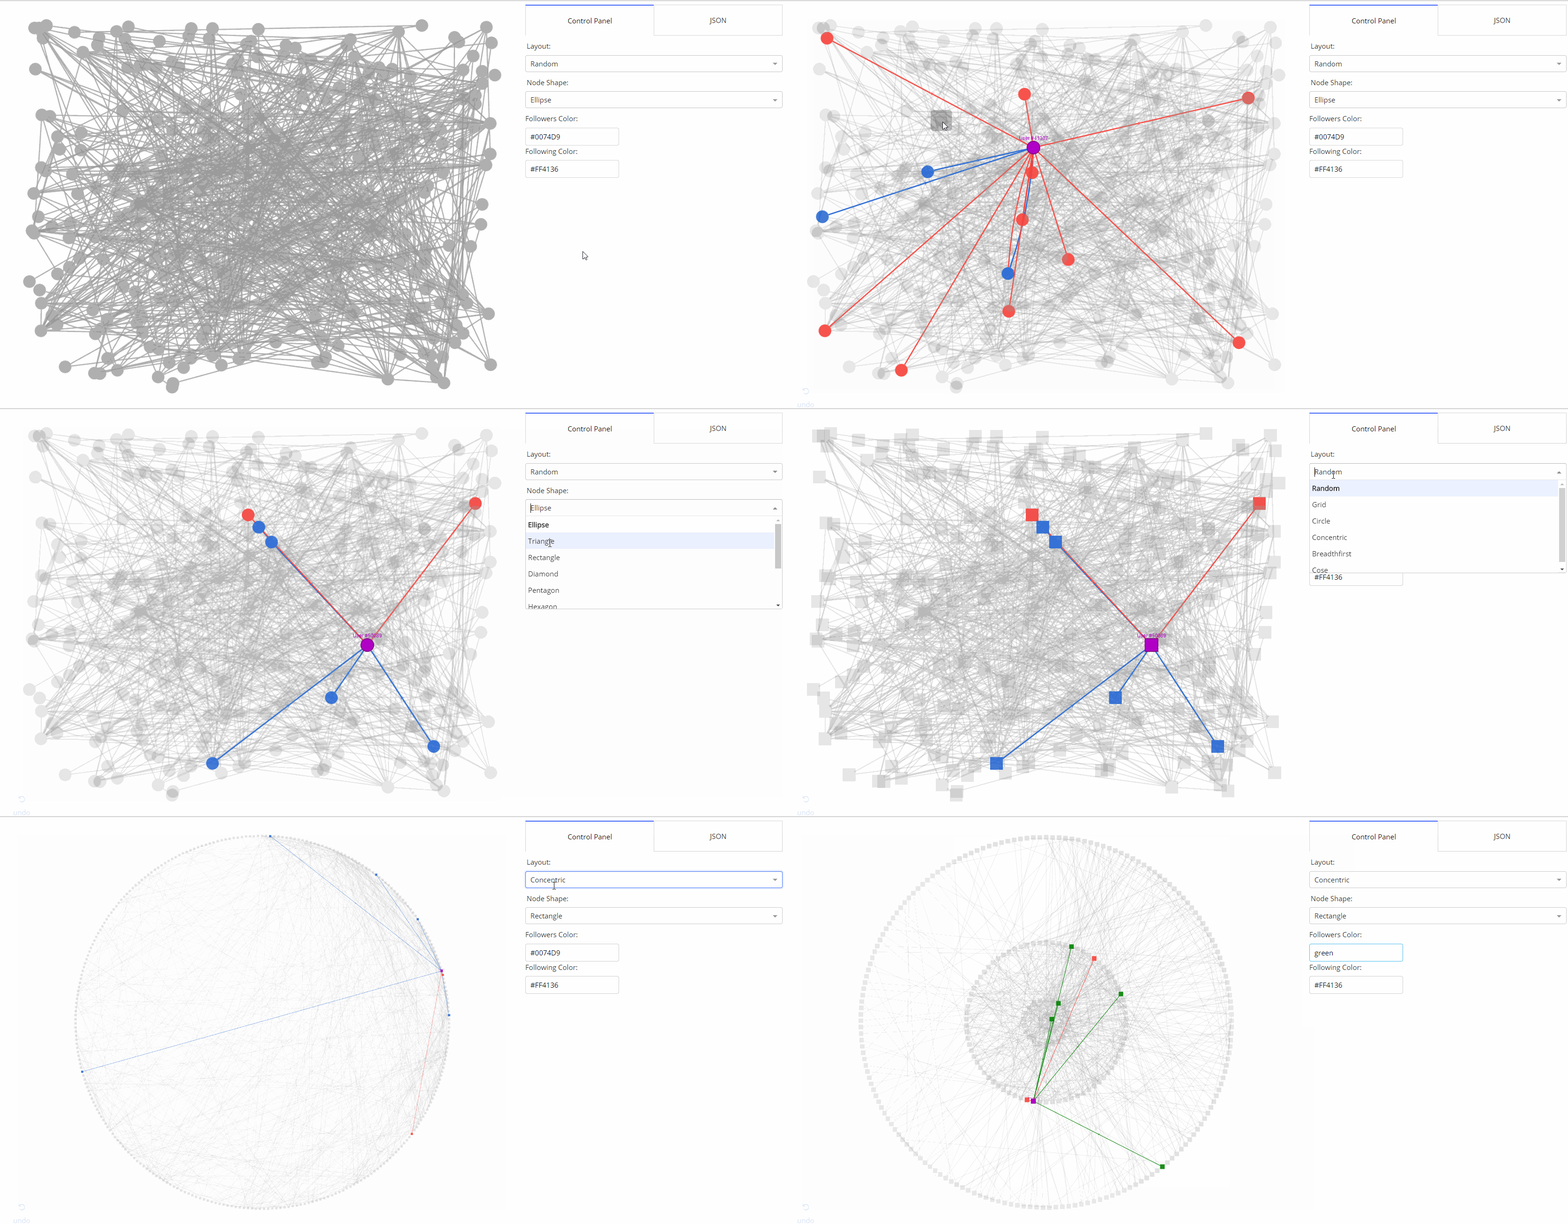
https://github.com/plotly/dash-cytoscape
Interactive network visualization in Python and Dash, powered by Cytoscape.js
https://github.com/plotly/dash-cytoscape
bioinformatics biopython computational-biology cytoscape cytoscapejs dash data-science graph-theory network-graph network-visualization plotly plotly-dash
Last synced: 4 months ago
JSON representation
Interactive network visualization in Python and Dash, powered by Cytoscape.js
- Host: GitHub
- URL: https://github.com/plotly/dash-cytoscape
- Owner: plotly
- License: mit
- Created: 2018-08-06T18:47:06.000Z (over 7 years ago)
- Default Branch: main
- Last Pushed: 2024-05-20T11:56:22.000Z (over 1 year ago)
- Last Synced: 2024-05-21T12:13:31.264Z (over 1 year ago)
- Topics: bioinformatics, biopython, computational-biology, cytoscape, cytoscapejs, dash, data-science, graph-theory, network-graph, network-visualization, plotly, plotly-dash
- Language: Python
- Homepage: https://dash.plot.ly/cytoscape
- Size: 68.5 MB
- Stars: 577
- Watchers: 28
- Forks: 122
- Open Issues: 67
-
Metadata Files:
- Readme: README.md
- Changelog: CHANGELOG.md
- Contributing: CONTRIBUTING.md
- Funding: .github/FUNDING.yml
- License: LICENSE
- Code of conduct: CODE_OF_CONDUCT.md
- Codeowners: .github/CODEOWNERS
Awesome Lists containing this project
- awesome-network-analysis - dash-cytoscape - Interactive network visualization library in Python, powered by Cytoscape.js and Dash (Software / Python)
- awesome-starred - plotly/dash-cytoscape - Interactive network visualization in Python and Dash, powered by Cytoscape.js (data-science)
- awesome-network-analysis - dash-cytoscape - Interactive network visualization library in Python, powered by Cytoscape.js and Dash (Software / Python)
- awesome-knowledge-management - Dash Cytoscape - A [Dash](https://plotly.com/dash/) component library for creating interactive and customizable networks in Python, wrapped around Cytoscape.js. (Libraries)
README
# Dash Cytoscape [](https://github.com/plotly/dash-cytoscape/blob/master/LICENSE) [](https://pypi.org/project/dash-cytoscape/)
[](https://circleci.com/gh/plotly/dash-cytoscape)
A Dash component library for creating interactive and customizable networks in Python, wrapped around [Cytoscape.js](http://js.cytoscape.org/).

- 🌟 [Medium Article](https://medium.com/@plotlygraphs/introducing-dash-cytoscape-ce96cac824e4)
- 📣 [Community Announcement](https://community.plotly.com/t/announcing-dash-cytoscape/19095)
- 💻 [Github Repository](https://github.com/plotly/dash-cytoscape)
- 📚 [User Guide](https://dash.plotly.com/cytoscape)
- 🗺 [Component Reference](https://dash.plotly.com/cytoscape/reference)
- 📺 [Webinar Recording](https://www.youtube.com/watch?v=snXcIsCMQgk)
## Getting Started in Python
### Prerequisites
Make sure that dash and its dependent libraries are correctly installed:
```commandline
pip install dash
```
If you want to install the latest versions, check out the [Dash docs on installation](https://dash.plotly.com/installation).
### Usage
Install the library using `pip`:
```
pip install dash-cytoscape
```
If you wish to use the CyLeaflet mapping extension, you must install the optional `leaflet` dependencies:
```
pip install dash-cytoscape[leaflet]
```
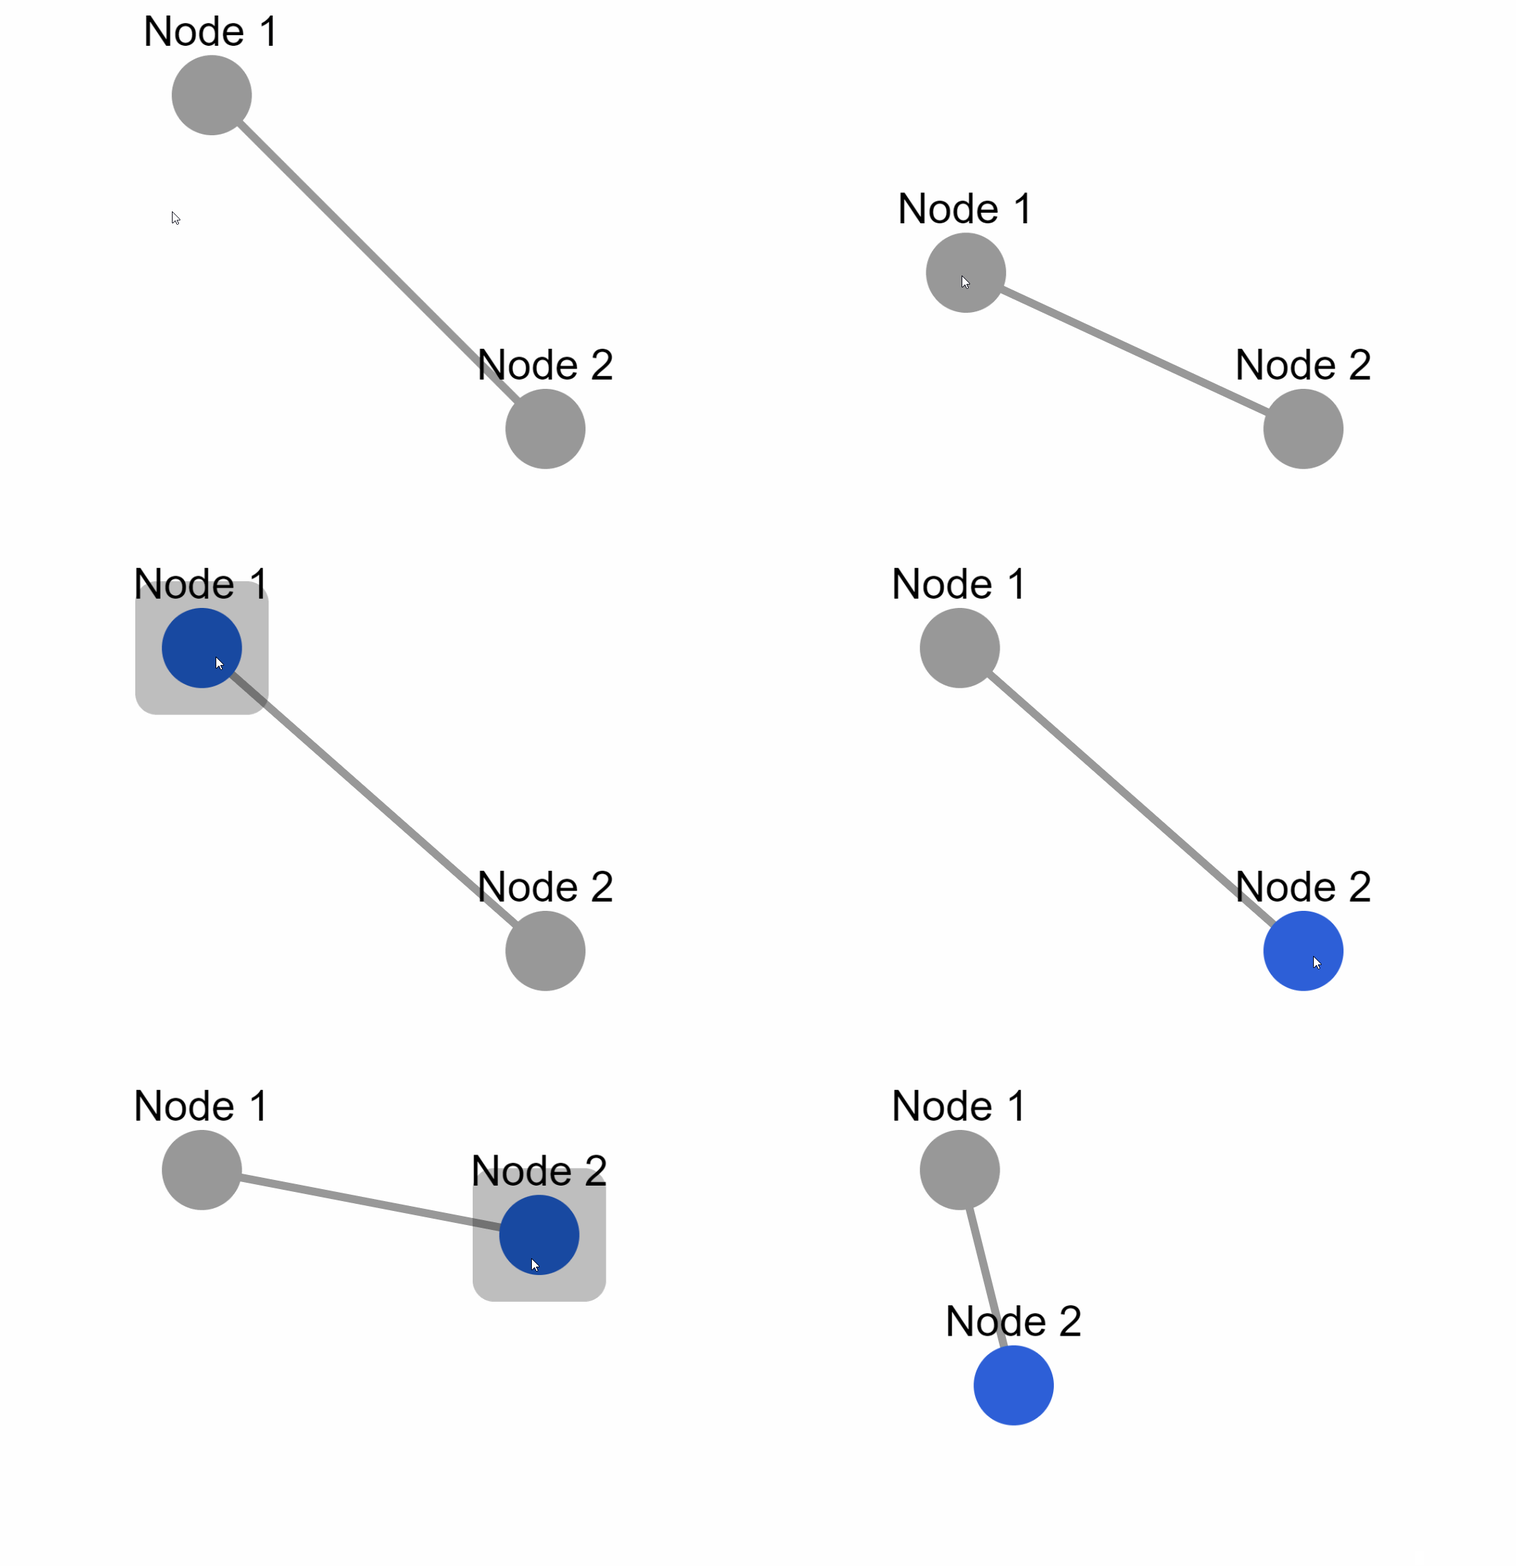
Create the following example inside an `app.py` file:
```python
import dash
import dash_cytoscape as cyto
from dash import html
app = dash.Dash(__name__)
app.layout = html.Div([
cyto.Cytoscape(
id='cytoscape',
elements=[
{'data': {'id': 'one', 'label': 'Node 1'}, 'position': {'x': 50, 'y': 50}},
{'data': {'id': 'two', 'label': 'Node 2'}, 'position': {'x': 200, 'y': 200}},
{'data': {'source': 'one', 'target': 'two','label': 'Node 1 to 2'}}
],
layout={'name': 'preset'}
)
])
if __name__ == '__main__':
app.run(debug=True)
```

### External layouts
You can also add external layouts. Use the `cyto.load_extra_layouts()` function to get started:
```python
import dash
import dash_cytoscape as cyto
from dash import html
cyto.load_extra_layouts()
app = dash.Dash(__name__)
app.layout = html.Div([
cyto.Cytoscape(...)
])
```
Calling `cyto.load_extra_layouts()` also enables generating SVG images.
## Getting Started in R
### Prerequisites
```R
install.packages(c("devtools", "dash"))
```
### Usage
Install the library using devtools:
```
devtools::install_github("plotly/dash-cytoscape")
```
Create the following example inside an `app.R` file:
```R
library(dash)
library(dashHtmlComponents)
library(dashCytoscape)
app <- Dash$new()
app$layout(
htmlDiv(
list(
cytoCytoscape(
id = 'cytoscape-two-nodes',
layout = list('name' = 'preset'),
style = list('width' = '100%', 'height' = '400px'),
elements = list(
list('data' = list('id' = 'one', 'label' = 'Node 1'), 'position' = list('x' = 75, 'y' = 75)),
list('data' = list('id' = 'two', 'label' = 'Node 2'), 'position' = list('x' = 200, 'y' = 200)),
list('data' = list('source' = 'one', 'target' = 'two'))
)
)
)
)
)
app$run_server()
```
## Documentation
The [Dash Cytoscape User Guide](https://dash.plotly.com/cytoscape/) contains everything you need to know about the library. It contains useful examples, functioning code, and is fully interactive. You can also use the [component reference](https://dash.plotly.com/cytoscape/reference/) for a complete and concise specification of the API.
To learn more about the core Dash components and how to use callbacks, view the [Dash documentation](https://dash.plotly.com/).
For supplementary information about the underlying Javascript API, view the [Cytoscape.js documentation](http://js.cytoscape.org/).
## Contributing
Make sure that you have read and understood our [code of conduct](CODE_OF_CONDUCT.md), then head over to [CONTRIBUTING](CONTRIBUTING.md) to get started.
### Testing
Instructions on how to run [tests](CONTRIBUTING.md#tests) are given in [CONTRIBUTING.md](CONTRIBUTING.md).
## License
Dash, Cytoscape.js and Dash Cytoscape are licensed under MIT. Please view [LICENSE](LICENSE) for more details.
## Contact and Support
See https://plotly.com/dash/support for ways to get in touch.
## Acknowledgments
Huge thanks to the Cytoscape Consortium and the Cytoscape.js team for their contribution in making such a complete API for creating interactive networks. This library would not have been possible without their massive work!
The Pull Request and Issue Templates were inspired from the
[scikit-learn project](https://github.com/scikit-learn/scikit-learn).
## Gallery
### Dynamically expand elements
[Code](usage-elements.py) | [Demo](https://dash-gallery.plotly.host/cytoscape-elements)

### Interactively update stylesheet
[Code](usage-stylesheet.py) | [Demo](https://dash-gallery.plotly.host/cytoscape-stylesheet)

### Automatically generate interactive phylogeny trees
[Code](demos/usage-phylogeny.py) | [Demo](https://dash-gallery.plotly.host/cytoscape-phylogeny/)

### Create your own stylesheet
[Code](usage-advanced.py) | [Demo](https://dash-gallery.plotly.host/cytoscape-advanced)

### Use event callbacks
[Code](usage-events.py) | [Demo](https://dash-gallery.plotly.host/cytoscape-events)

### Use external layouts
[Code](demos/usage-elements-extra.py)

### Use export graph as image
[Code](demos/usage-image-export.py)

### Make graph responsive
[Code](demos/usage-responsive-graph.py)

For an extended gallery, visit the [demos' readme](demos/README.md).
