https://github.com/pmeisen/js-gantt
Library to create simple charts visualizing time intervals with rich configuration capabilities and easy adaptable data loading.
https://github.com/pmeisen/js-gantt
activities activity activity-chart chart gantt gantt-chart interval intervals javascript js-gantt svg task task-chart tasks time-interval time-interval-data time-intervals timeinterval visualization
Last synced: 5 months ago
JSON representation
Library to create simple charts visualizing time intervals with rich configuration capabilities and easy adaptable data loading.
- Host: GitHub
- URL: https://github.com/pmeisen/js-gantt
- Owner: pmeisen
- License: mit
- Created: 2015-03-05T14:55:33.000Z (over 11 years ago)
- Default Branch: master
- Last Pushed: 2017-09-06T02:18:15.000Z (almost 9 years ago)
- Last Synced: 2026-01-23T21:58:12.667Z (6 months ago)
- Topics: activities, activity, activity-chart, chart, gantt, gantt-chart, interval, intervals, javascript, js-gantt, svg, task, task-chart, tasks, time-interval, time-interval-data, time-intervals, timeinterval, visualization
- Language: JavaScript
- Homepage:
- Size: 1.59 MB
- Stars: 30
- Watchers: 2
- Forks: 5
- Open Issues: 1
-
Metadata Files:
- Readme: README.md
- License: LICENSE
Awesome Lists containing this project
README
# js-gantt
[](https://badge.fury.io/bo/js-gantt)
[](https://badge.fury.io/js/js-gantt)
[](https://travis-ci.org/pmeisen/js-gantt)
Library to create time interval data charts, easily, simple and highly configurable. The created charts can be used to visualize large time interval datasets.
The rich configuration allows among other things:
- customizable axes labeling,
- modifiable sizing for all visual components (i.e., intervals, swim-lanes, chart, axes)
- rule-based coloring,
- tooltip configuration, and
- many many more.
## How to Install
The library can be used with `bower`, `requireJs` or as individual `JavaScript Import`. The following paragraphs
explain how to use the library in the different scenarios.
### Using js-gantt with `bower`
```
bower install --save js-gantt
```
The library will be added to your `bower-components`. By default the `js-gantt.js` is selected as single main file, which is the
not minified version of the library (the minified/uglified version is `js-gantt.min.hs`). Examples on how to use the library can
be found [here](#usage-examples).
### Using js-gantt with `requireJs`
If you are building larger web-applications and you want to enjoy the advantage of [requireJs](http://requirejs.org/), you
need to include the sources (and not the optimized libraries). To do so, you may download the tarball or a zip-archive from
GitHub and place it into your `scripts` folder. You can also utilize `npm` or `bower` to download the sources automatically
and override the `main` configuration (see [here](#advanced-bower-and-requirejs)). You can then require the needed library as following:
```javascript
require(['net/meisen/ui/gantt/GanttChart'], function (SvgLibrary) {
var gantt = new GanttChart();
});
```
### Using js-gantt with `JavaScript Import`
If you simple want to use the library within your web-site, you can easily do so by downloading it, deploying it on your
server and adding `...` tags:
```html
```
The library is bound to the `window` instance and thus is directly available for any other script:
```html
var chart = new GanttChart();
var el = document.getElementById('chart');
chart.init(el, {
data: {
names: ['start', 'end', 'label'],
records: chart.createSampleData(n, 6),
mapper: {
startname: 'start',
endname: 'end',
tooltip: ['label']
},
timeaxis: {
end: chart.createSampleEnd(n),
granularity: 'mi'
}
}
});
chart.resize(500, 250);
```
If you'd like to have this library available through a CDN, please **Star** the project.
## Usage Examples
Here are some [jsFiddle](https://jsfiddle.net/) examples utilizing the library. All examples are purely based
on this library, no additional dependencies needed.
### A First Example: Showing some sample time intervals
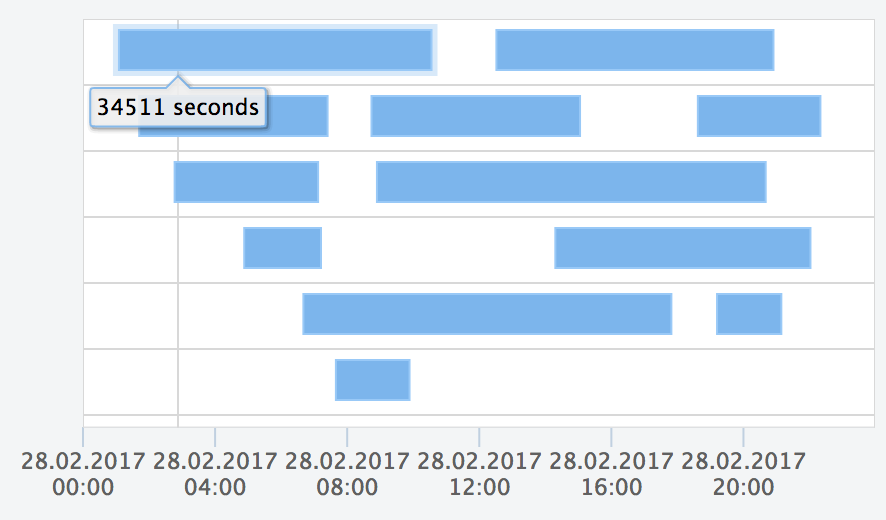
https://jsfiddle.net/pmeisen/pfg7t1uw/
This example demonstrates how easy it is to use the library and config some different aspects like:
- data:
- loading of data
- mapping
- time-axis
- illustrator:
- scrollbars
- axis
- theme (interval size)
### Rule-based Coloring: Example on how to utilize rule-based coloring for time intervals
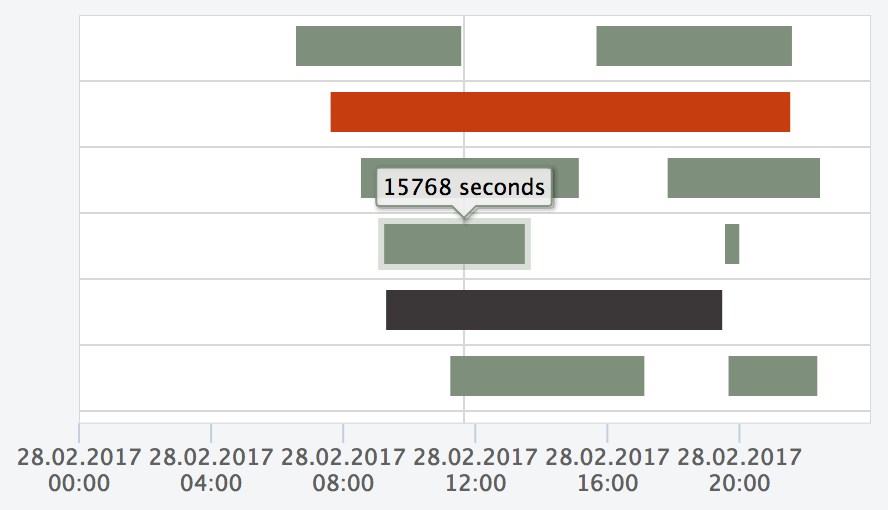
https://jsfiddle.net/pmeisen/sL7dckbs/
The example shows how to use the `colorizer` to specify rule-based colors for the intervals. You simple have to override the default-configuration
of the `colorizer`, which is done in the example (see [Configuration](#configuration) for further information):
```javascript
var config = {
illustrator: {
config: {
view: {
coloring: {
colorizer: function (interval, map, defaultColor) {
var record = interval.get(IntervalView.gRawAttr);
var value = map.val('label', record);
var n = parseInt(value);
if (n > 0 && n <= 25000) {
return '#7E8F7C';
} else if (n > 25000 && n <= 50000) {
return '#3B3738';
} else if (n > 50000 && n <= 90000) {
return '#C63D0F';
} else {
return defaultColor;
}
}
}
}
}
}
};
```
### External DataSource: Example on how to use an external data-source
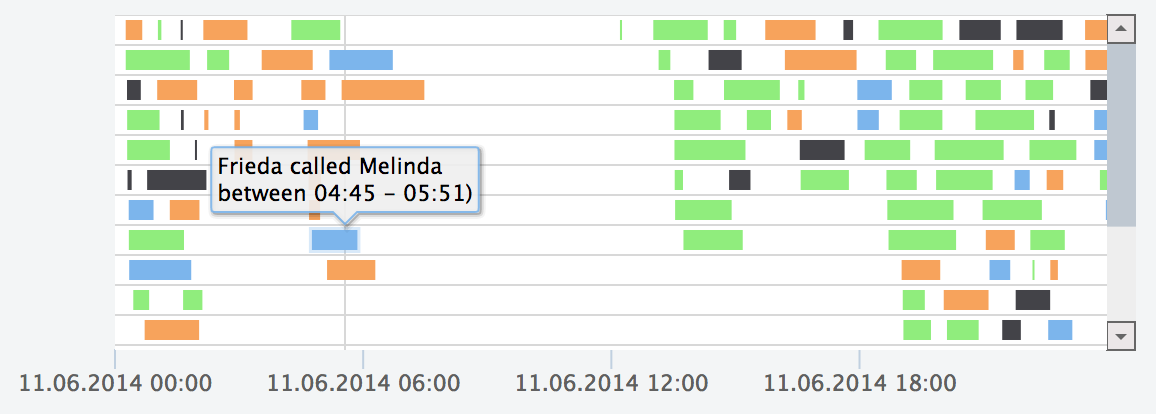
https://jsfiddle.net/pmeisen/r16qfrnx/
Most often an external data source is used to visualize data. The library expects the data to be in JSON Array form, i.e.:
```json
[
["Clara","11.06.2014 00:15:32","11.06.2014 00:39:32",24,"Tristan","Maryland","Tajikistan",0.22,5.28,"United States","Asia","Female","Male" ],
["Niklas","11.06.2014 00:15:35","11.06.2014 01:48:35",93,"Jesko","Florida","Tuvalu",1.84,171.12,"United States","Oceania","Male","Male" ],
["Niklas","11.06.2014 00:17:25","11.06.2014 00:37:25",20,"Anni","Florida","Cayman Islands",0.24,4.8,"United States","Oceania","Male","Female" ],
]
```
There are several good online tools to convert different formats into a JSON data form, e.g., for CSV [convertcsv.com](http://www.convertcsv.com/csv-to-json.htm).
Nevertheless, sometimes the data that you receive, e.g., from an url, is not in JSON form. To solve this problem, the library provides a configuration, which
allows you to post-process `JSON` data, e.g., retrieved from a web-service. In the jsFiddle, the loaded data is `post-processed` via the following `function`:
```javascript
var config = {
data: {
postProcessor: function (data) {
var f = 'dd.MM.yyyy HH:mm:ss';
for (var i = 0; i < data.length; i++) {
var record = data[i];
record[1] = GanttChart.DateUtil.parseString(record[1], f);
record[2] = GanttChart.DateUtil.parseString(record[2], f);
}
return {
names:['caller', 'start', 'end',
'duration', 'recipient', 'origin',
'destination', 'ratepermin', 'costs',
'origincontinent', 'destinationcontinent',
'callergender','recipientgender'],
records: data
};
}
}
};
```
The library needs an `object` defining the `names` and `records`, i.e., `{ names: [], records: [] }`. Thus, the `postProcessor` function must return such an object. The `names` are an array naming the different
values of each record; it can be understood as the header of a CSV-file. The records contain the actual data, which have to ensure, that the values representing the start and end value of the interval, must be a `Date` type.
If the returned data is not a `JSON`, the library offers a `loader` configuration, which defines how to load data. The loader
must be implemented as:
```
var config = {
data: {
loader: function (success, error) {
// success and error are both functions, with:
// - success: function(data);
// - error: function(msg);
}
}
};
```
Further examples using different `post-processor` and `loader` definitions can be found:
- mapping JSON objects (e.g., [sample-data.json](https://rawgit.com/pmeisen/js-gantt/master/resources/sample-data.json)) to the required data format: [jsFiddle: post-processing](https://jsfiddle.net/pmeisen/pj9thh4z/)
- using a loader (e.g., loading CSV [sample-data.csv](https://rawgit.com/pmeisen/js-gantt/master/resources/sample-data.csv)) to the required data format: [jsFiddle: loader](https://jsfiddle.net/pmeisen/11z6o8pn/)
## Configuration
The Gantt Chart library provides a rich set of configuration parameters. This paragraph tries to address the none trivial settings.
To get an easy start, it is recommend to look at the [Usage Examples](#usage-examples) and adapt the different configuration
parameters as needed and described here.
A full configuration (with the default settings) is as follows:
```javascript
var config = {
data: {
url: null,
loader: null,
postProcessor: function (data) {
if (!$.isArray(data.names) || !$.isArray(data.records)) {
return null;
} else {
return data;
}
},
mapper: {
startname: 'start',
endname: 'end',
group: [],
label: [],
tooltip: []
},
names: [],
records: [],
timeaxis: {
start: null,
end: null,
granularity: 'days'
}
},
theme: {
loadingBackgroundColor: '#CCCCCC',
loadingBackgroundPosition: 'center center',
loadingBackgroundRepeat: 'no-repeat',
errorBackgroundColor: '#A30B1D'
},
illustrator: {
factory: function () {
// the default configuration is based on this usage
return new SvgIllustrator();
},
config: {
theme: {
fontFamily: '"Lucida Grande", "Lucida Sans Unicode", Arial, Helvetica, sans-serif',
fontSize: '12px'
},
general: {
margin: 2
},
view: {
showGrid: true,
showBorder: true,
showBackground: true,
showPositionMarker: true,
showIntervalMarker: true,
showPositionToolTip: true,
showIntervalToolTip: true,
coloring: {
groupMapping: null,
colorizer: function (interval, map, defaultColor) {
// there is a default implemented, please have
// a look at the source-code (IntervalView.js)
// for further insights
}
},
tooltip: null,
formatter: {
tooltip: function (interval, map, textFormat, theme) {
// there is a default implemented, please have
// a look at the source-code (IntervalView.js)
// for further insights
}
},
theme: {
backgroundColor: '#FFFFFF',
laneHeight: null,
intervalPosition: 'middle',
intervalHeight: 20,
intervalColor: '#7CB5EC',
intervalBorderColor: '#99C9F7',
intervalBorderSize: 1,
gridColor: '#D8D8D8',
gridSize: 1,
positionMarkerColor: '#D8D8D8',
positionMarkerSize: 1,
intervalMarkerOpacity: '0.3',
intervalMarkerWidth: null,
borderColor: '#D8D8D8',
borderSize: 1,
tooltipMargin: 2,
tooltipArrow: 6,
tooltipRadius: 3,
tooltipSize: 11,
tooltipTextColor: '#000000',
intervalMarginInPx: null
}
},
axis: {
tickInterval: null,
viewSize: null,
padding: 100,
formatter: function (value, type, level) {
// there is a default formatter, please have
// a look at the source-code (TimeAxis.js)
// for further insights
},
theme: {
tickColor: '#C0D0E0',
tickWidth: 1,
labelColor: '#606060',
labelSize: 11
}
},
scrollbars: {
vertical: {
theme: {
arrowSize: 14,
scrollareaColor: '#EEEEEE',
markerColor: '#BFC8D1',
buttonColorBorder: '#666666',
arrowColor: '#666666',
buttonColor: '#EBE7E8'
},
hideOnNoScroll: false,
propagateScrollOnNoMove: false,
step: null
},
horizontal: {
theme: {
arrowSize: 14,
scrollareaColor: '#EEEEEE',
markerColor: '#BFC8D1',
buttonColorBorder: '#666666',
arrowColor: '#666666',
buttonColor: '#EBE7E8'
},
hideOnNoScroll: true,
propagateScrollOnNoMove: false,
step: null
}
}
}
},
position: 'center',
throwException: false
};
```
Most of the configuration parameters should be self explaining (if not please contact me, so that I can enhance the documentation). Nevertheless, one of the
most important things to understand is the `data` section within the configuration. Which is explained in the following paragraph.
### Configuration: Data Section
In general, the library tries to retrieve time interval data in the following order (it is not recommended to mix the different
ways and only utilize one of the ways to retrieve data):
1. check if a loader is defined (data must be returned as `JSON`)
2. check if an url is defined (data must be returned as `JSON`)
3. check if `records` are set
If step 1. or 2. are used, the returned `JSON` is passed to the `post-processor`, if one is defined (`data.postProcessor` must be a `function`).
The `post-processor` must return an `JSON` fulfilling the following requirements:
1. must be a plain-object (`JSON`)
2. must have a named `records` attribute, which contains the time-interval data as arrays and each date as UTC-based `Date`, i.e.,
```javascript
[
GanttChart.DateUtil.createUTC(1929, 10, 31, 0, 0, 0),
GanttChart.DateUtil.createUTC(2016, 6, 27, 0, 0, 0),
'actor',
'Bud Spencer',
'Carlo Pedersoli'
]
```
3. must have a named `names` attribute, which returns an array of `names` for the different values in the `records` array, i.e.,
```javascript
[
'birthday',
'dayOfDeath',
'type',
'alias',
'name'
]
```
So all together, it must return:
```javascript
loader: function(success, error) {
success({
names: [
'birthday',
'dayOfDeath',
'type',
'alias',
'name'
],
records: [
[
GanttChart.DateUtil.createUTC(1929, 10, 31),
GanttChart.DateUtil.createUTC(2016, 6, 27),
'actor',
'Bud Spencer',
'Carlo Pedersoli'
],
[
GanttChart.DateUtil.createUTC(1939, 3, 29),
null,
'actor',
'Terence Hill',
'Mario Girotti'
]
]
})
};
```
The next important setting within the `data` section of the configuration is the `mapper`. The mapper configuration is used to
define, which values of each record have what semantic meaning, e.g., which value indicates the `startname` of the interval and which
one the `endname`. By default, the library assumes that the `startname` is `start` and the `endname` is `end`. Assuming the `names`
from the previous paragraph, this default setting is incorrect and would need to be modified:
```javascript
mapper: {
startname: 'birthday',
endname: 'dayOfDeath'
}
```
Additional mappers can be defined for `groups`, `labels` and `tooltips`, i.e.,
```javascript
mapper: {
startname: 'birthday',
endname: 'dayOfDeath',
group: ['type'],
label: ['alias'],
tooltip: ['name', 'alias']
}
```
These values are used by the library to, e.g., offer group-based coloring, showing tool-tips on hover events or add a label
to an interval.
**Notes**:
- the `GanttChart` provides some utility functions, which makes it easier to parse (e.g., `parseString`) or create (e.g., `createUTC`) UTC dates.
- the `end` date can be `null`, which indicates that the interval has not ended yet (glued to the end of the chart).
- an example using the data of this example can be found here: [jsFiddle](https://jsfiddle.net/pmeisen/boxtwojx/)
## Advanced: Bower and RequireJs
If you utilize the library with `requireJs`, you may want to use the `sources` instead of the minified or combined version
distributed in the `dist`-folder. The library is developed using `requireJs` and ensures an easy usage with any
`Asynchronous Module Definition` (see [AMD](https://github.com/amdjs/amdjs-api/wiki/AMD)).
If you have a look at the project's `gruntfile.js`, you will notice, that the libraries supporting `AMD` (e.g., `js-misc`,
`js-svglibrary`) are also added to this project using their sources. The following lines in the `gruntfile.js` ensures that
usage:
```json
{
"bower": {
"dep": {
"options": {
"includeDev": true,
"checkExistence": true,
"paths": "bower-components",
"overrides": {
"js-misc": {"ignore": true},
"js-svglibrary": {"ignore": true}
}
},
"dest": "scripts"
}
},
"copy": {
"dep": {
"files": [
{"expand": true, "flatten": false, "cwd": "bower-components/js-gantt/src", "src": "**/*", "dest": "scripts"}
]
}
}
}
```
## Further Links
- [Examples](examples/README.md)