https://github.com/pocc/pcapgraph
Visualize a pcap with a matplotlib graph
https://github.com/pocc/pcapgraph
Last synced: over 1 year ago
JSON representation
Visualize a pcap with a matplotlib graph
- Host: GitHub
- URL: https://github.com/pocc/pcapgraph
- Owner: pocc
- License: apache-2.0
- Created: 2018-09-24T13:50:10.000Z (almost 8 years ago)
- Default Branch: master
- Last Pushed: 2022-06-21T21:26:48.000Z (about 4 years ago)
- Last Synced: 2024-05-01T15:32:00.024Z (about 2 years ago)
- Language: Python
- Size: 753 KB
- Stars: 4
- Watchers: 6
- Forks: 1
- Open Issues: 3
-
Metadata Files:
- Readme: README.md
- License: LICENSE.txt
Awesome Lists containing this project
README
# PcapGraph
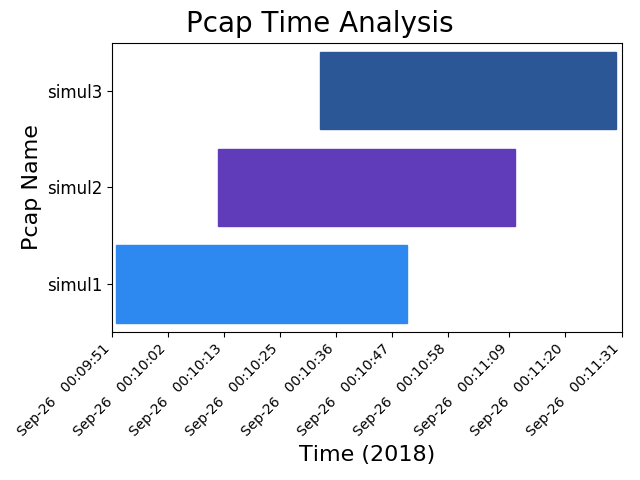
Creates bar graphs out of packet capture timestamps.
#### Platforms
Linux, Macos, Windows
#### Description
* Assists with flow-based troubleshooting where there are at
least 2 pcaps. See [Usage](https://pcapgraph.readthedocs.io/en/latest/example_usage.html)
for detailed use cases and options.
* Create a horizontal bar graph to visualize when pcaps were taken.
* Use set operations to find patterns among multiple packet
captures in ways that Wireshark is not able to.
* If an output format is not specified, the default behavior is to print to
stdout and send a [matplotlib](https://matplotlib.org/) graph to the
screen (thus the name).
Official Documentation can be found at
[Read the Docs](https://pcapgraph.readthedocs.io/en/latest/).
## License
Apache 2.0. See LICENSE for more details.
## Acknowledgements
Praise be Stack Overflow!