https://github.com/poiscript/tracing-newrelic
New Relic integration for tracing
https://github.com/poiscript/tracing-newrelic
newrelic rust tracing
Last synced: 4 months ago
JSON representation
New Relic integration for tracing
- Host: GitHub
- URL: https://github.com/poiscript/tracing-newrelic
- Owner: PoiScript
- License: mit
- Created: 2020-12-23T16:37:15.000Z (over 5 years ago)
- Default Branch: a
- Last Pushed: 2024-03-04T10:45:27.000Z (over 2 years ago)
- Last Synced: 2025-03-18T05:13:16.050Z (over 1 year ago)
- Topics: newrelic, rust, tracing
- Language: Rust
- Homepage:
- Size: 989 KB
- Stars: 11
- Watchers: 2
- Forks: 4
- Open Issues: 4
-
Metadata Files:
- Readme: README.md
- License: LICENSE
Awesome Lists containing this project
README
# tracing-newrelic
New Relic integration for tracing
## Overview
This crate provides a layer for collecting trace data from [`tracing`] and sending them to [New Relic].
`tracing::Span` will be tried as Trace Span, and `tracing::Event` as Logs.
`tracing::Attribute` and `tracing::Metadata` wil be tried as Custom Attributes.
[`tracing`]: https://github.com/tokio-rs/tracing
[New Relic]: https://newrelic.com
## Examples
```rust
use std::thread::sleep;
use std::time::Duration;
use tracing_subscriber::{layer::SubscriberExt, Registry};
#[tracing::instrument(name = "fibonacci()")]
fn fibonacci(n: u32) -> u32 {
let ms = 100 * n as u64;
tracing::info!(n = n, "sleep {}ms", ms);
sleep(Duration::from_millis(ms));
match n {
0 | 1 => 1,
_ => fibonacci(n - 1) + fibonacci(n - 2),
}
}
fn main() {
env_logger::init();
let newrelic = tracing_newrelic::layer("YOUR-API-KEY");
let fmt = tracing_subscriber::fmt::layer();
let subscriber = Registry::default().with(newrelic).with(fmt);
tracing::subscriber::with_default(subscriber, || {
let span = tracing::info_span!(
"calculating fibonacci(3)",
service.name = "tracing-newrelic-demo"
);
let _enter = span.enter();
fibonacci(3);
});
}
```
1. Replace `YOUR-API-KEY` above with your api key and run it.
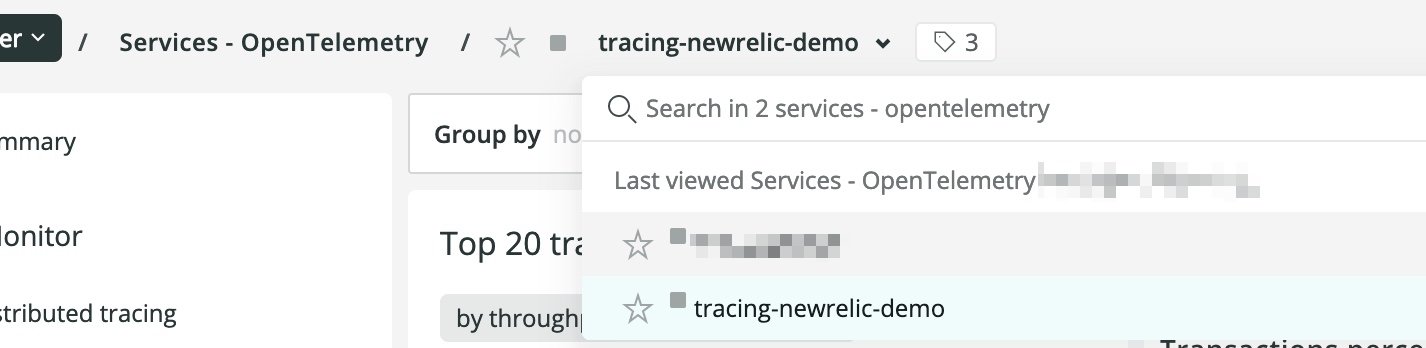
2. Open [New Relic One], navigate to `Entity explorer` and search for `tracing-newrelic-demo`.
3. You should see a entry span named `calculating fibonacci(3)` and click it for more details:
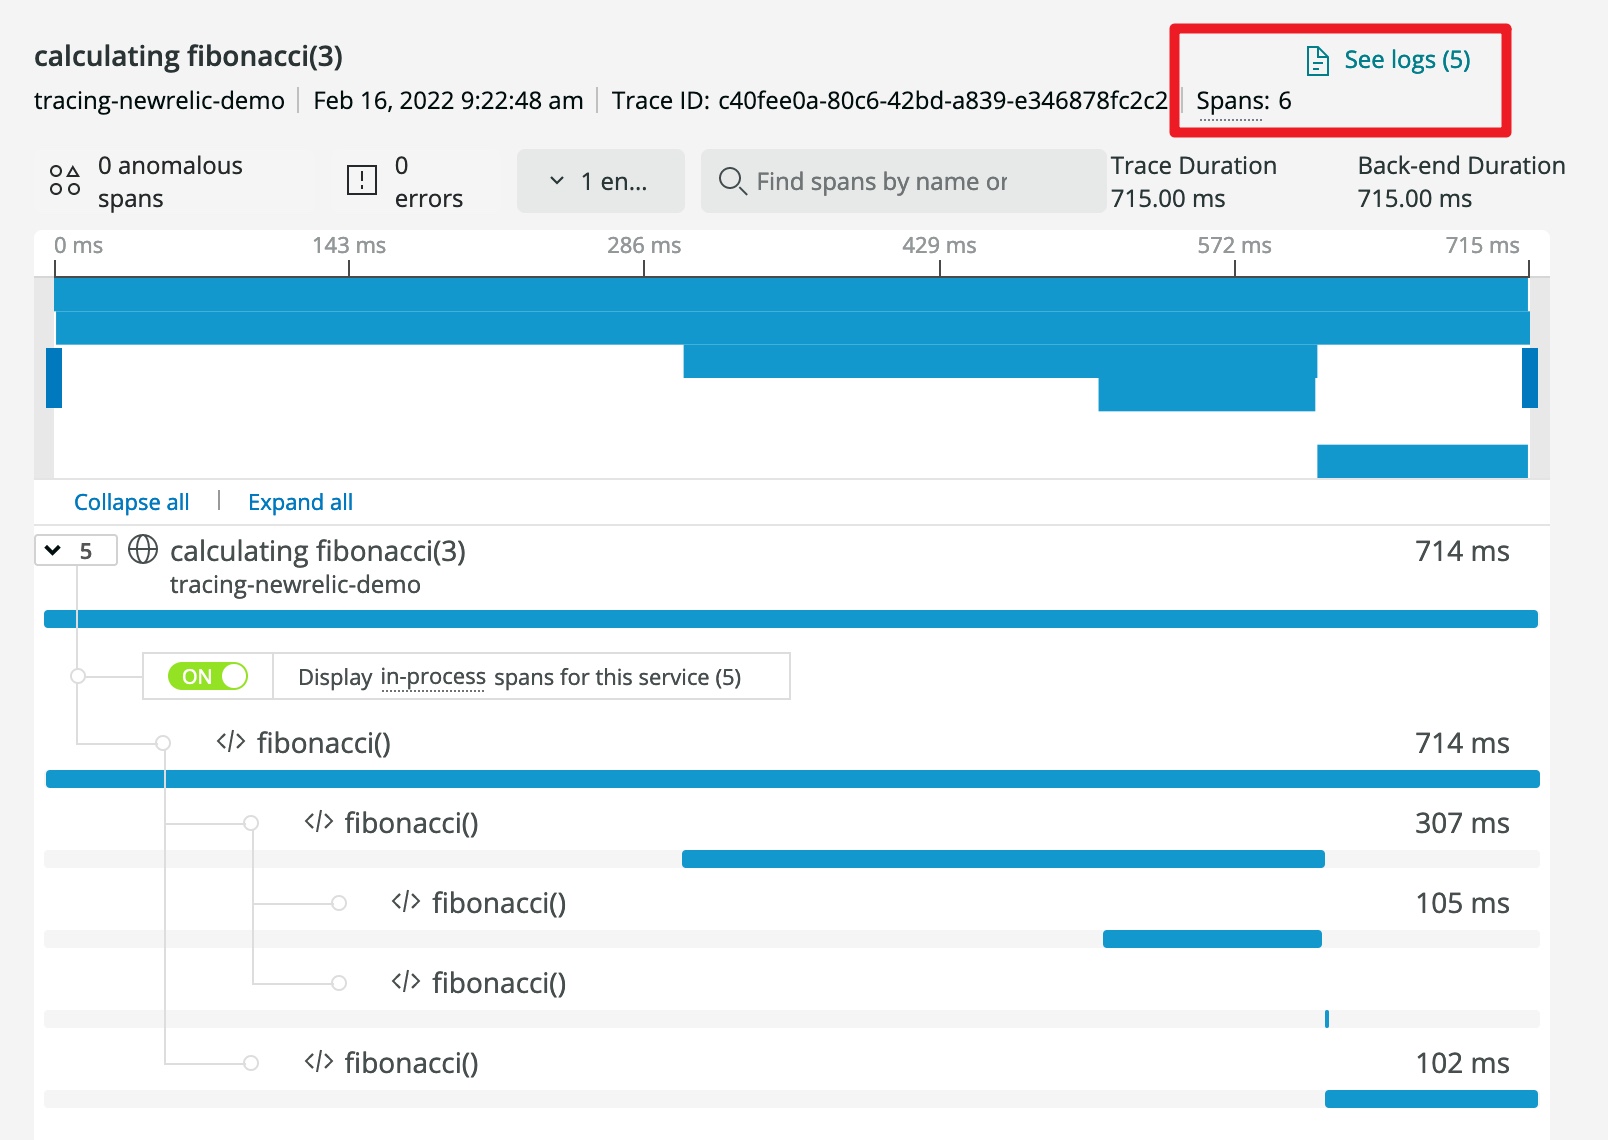
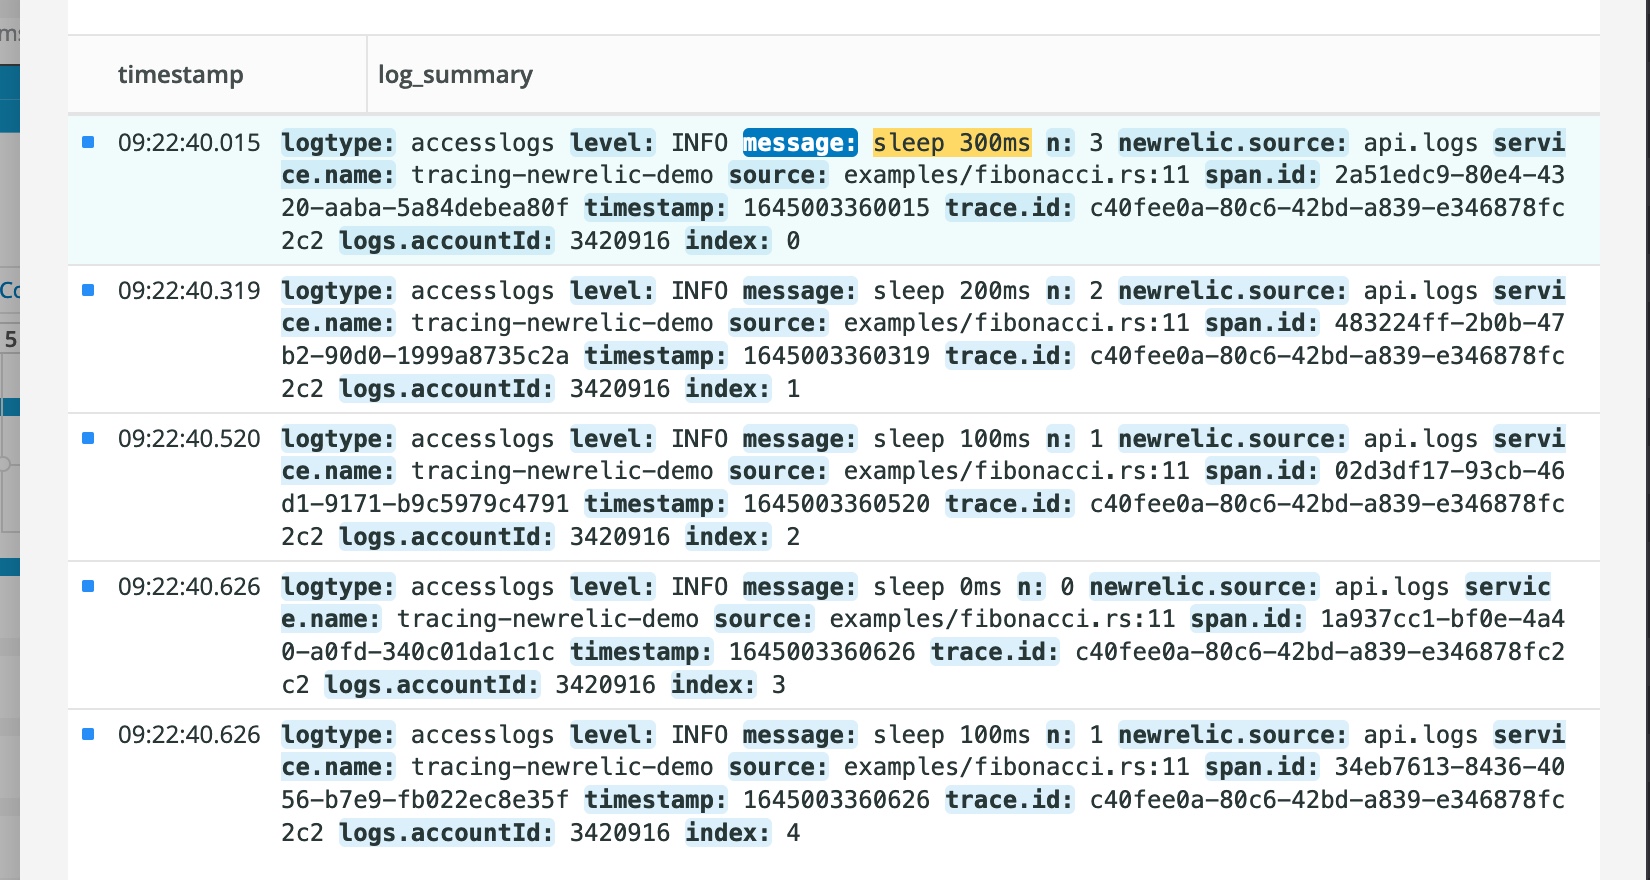
4. Click `See logs` to view all events inside this span:
[New Relic One]: http://one.newrelic.com
And I strongly recommend include these attributes in your spans:
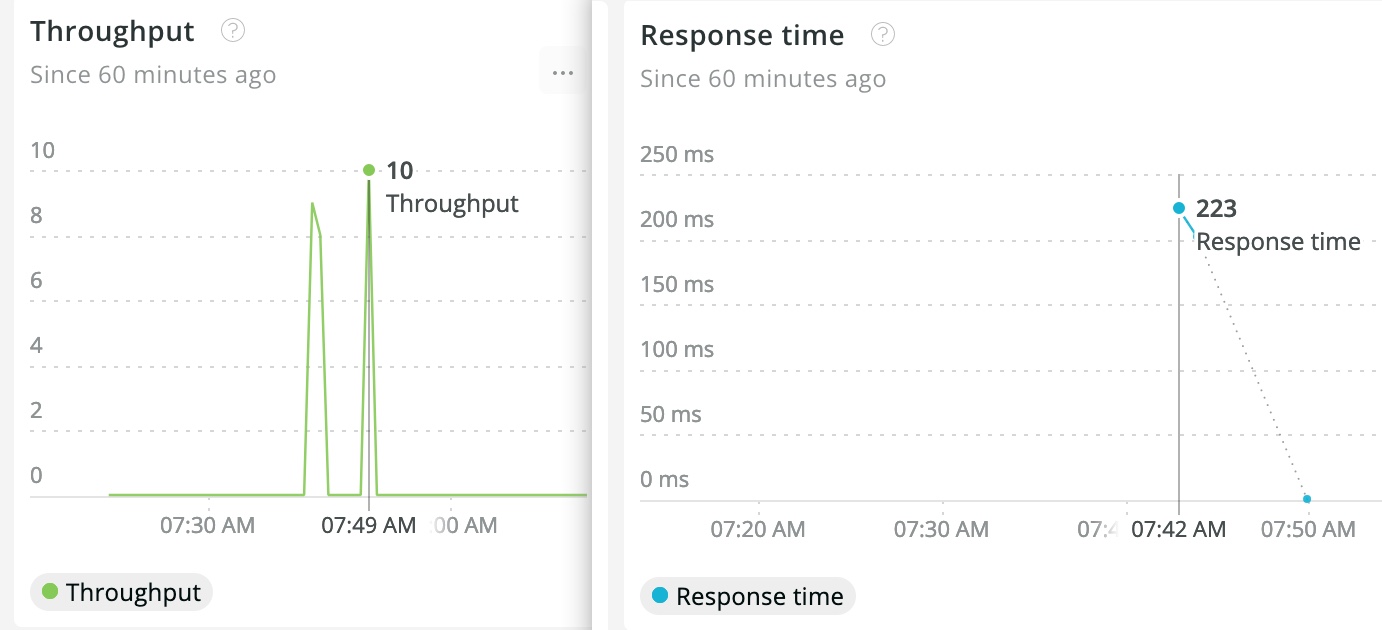
1. `span.kind`
New Relic creates throught and response time dashboards for spans with `span.kind` set to `server` and `consumer`.
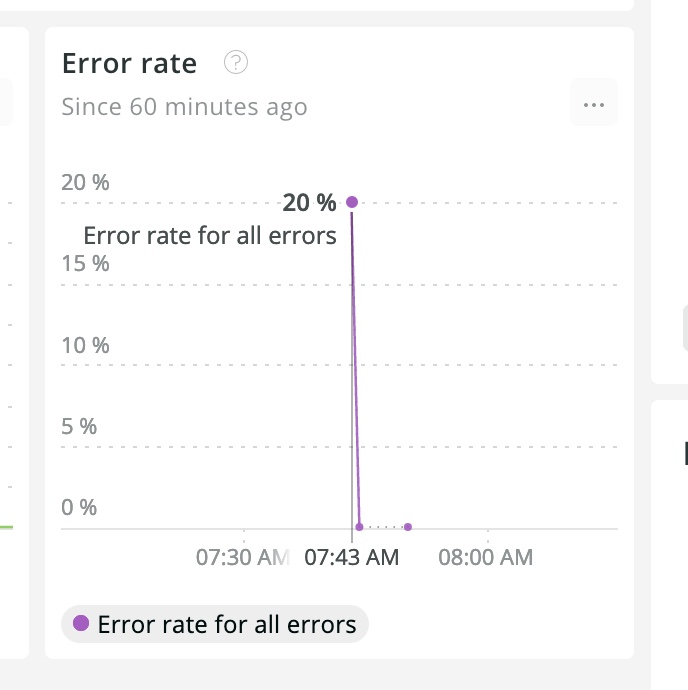
2. `otel.status_code` & `otel.status_description`
New Relic creates error rate dashboard for spans with `otel.status_code` set to `ERROR`.
3. `service.name`
New Relic group entity by their `service.name` field.
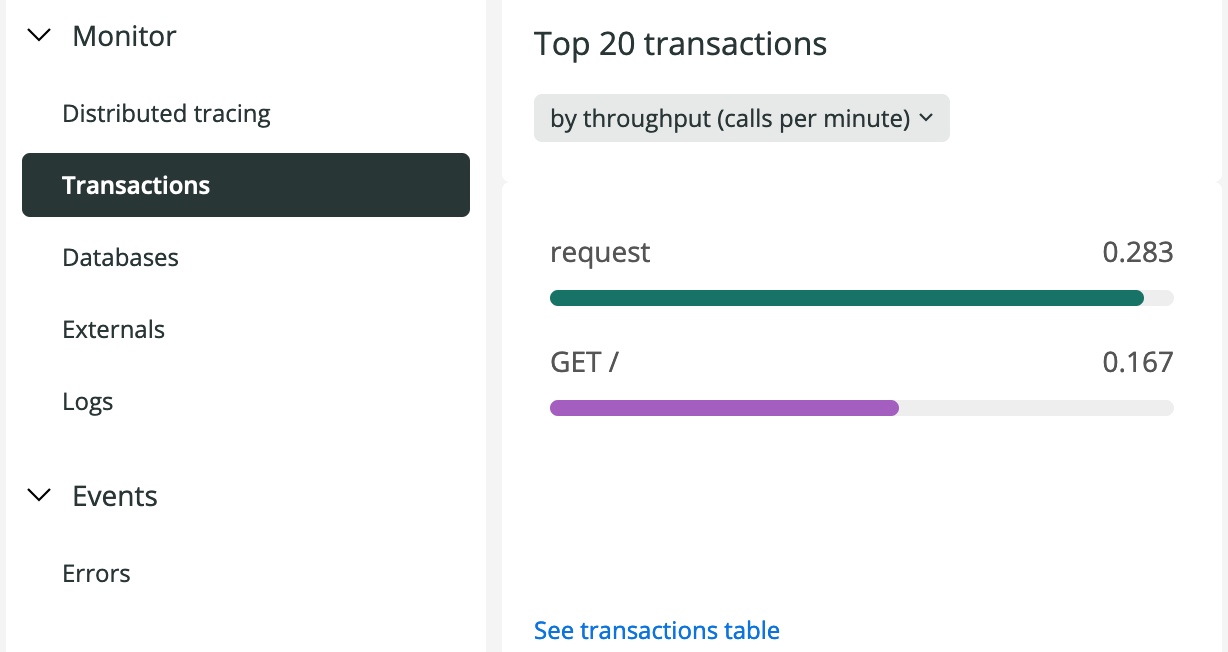
4. `name`
New Relic group trnsations by their `name` field.
## License
MIT