https://github.com/populatetools/perspective-map
Perspective plugin to create a map with Leaflet
https://github.com/populatetools/perspective-map
Last synced: about 1 year ago
JSON representation
Perspective plugin to create a map with Leaflet
- Host: GitHub
- URL: https://github.com/populatetools/perspective-map
- Owner: PopulateTools
- License: mit
- Created: 2021-04-29T04:42:03.000Z (about 5 years ago)
- Default Branch: main
- Last Pushed: 2025-02-20T05:13:03.000Z (over 1 year ago)
- Last Synced: 2025-04-21T00:09:13.506Z (about 1 year ago)
- Language: JavaScript
- Size: 1.76 MB
- Stars: 2
- Watchers: 5
- Forks: 1
- Open Issues: 0
-
Metadata Files:
- Readme: README.md
- License: LICENSE
Awesome Lists containing this project
README
Perspective Map
🗺


## Table of Contents
- [Installation](#Installation)
- [Requeriments](#requeriments)
- [Dependencies](#Dependencies)
- [How to use](#use)
- [Examples](#examples)
- [Development](#Development)
## Installation
You can also load directly from UNPKG as a standalone library.
```html
```
As a module with NPM or YARN
```bash
# npm
npm i perspective-leaflet --save-dev
# yarn
yarn add perspective-leaflet
```
And then import it:
```javascript
import perspective from "@finos/perspective";
import "@finos/perspective-viewer";
import "@finos/perspective-viewer-datagrid";
import "@finos/perspective-viewer-d3fc";
import "@finos/perspective-viewer/themes/all-themes.css";
import "perspective-map";
```
## Requirements
The plugin has been tested with the latest versions of Perspective (>= 0.8.0) which was released on 28.04.2021.
You will also need to include the Leaflet CSS
```html
```
Or
```javascript
import "leaflet/dist/leaflet.css";
```
## How to use
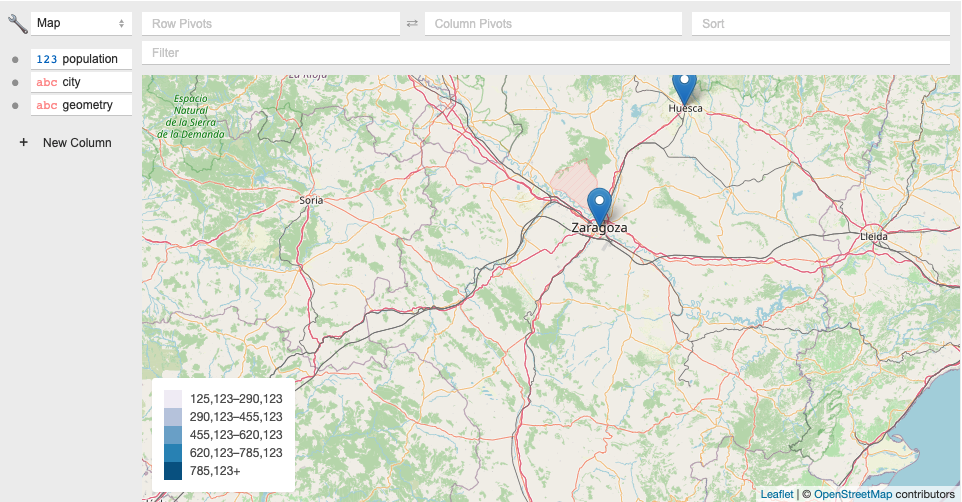
The plugin expects to receive the data as CSV, and it should have a column called `geometry`, which will have the geospatial data in GeoJSON or TopoJSON format (string-like).
An example:
```csv
population,city,geometry
785123,"Zaragoza","{""type"":""Point"",""coordinates"":[-0.8850860595703125,41.64828831259533]}"
125123,"Teruel","{""type"":""Point"",""coordinates"":[-1.1061859130859375,40.345497469392406]}"
785123,"Huesca","{""type"":""Point"",""coordinates"":[-0.41473388671875,42.14202329789122]}"
```
### config-map
You can choose the metric and zoom value of the map with the `map-config. This attribute is optional.
Create an object
```javascript
const configMap = {
metric: "population",
zoom: true
}
```
`metric: string` This is the column of data used to color the map and display it in the legend. If not defined, the map uses the first value of the data.
`zoom: boolean`, enable/disable the zoom of the map.
Stringify the object to add it as an attribute to the `perspective-viewer`.
```javascript
const element = document.getElementsByTagName("perspective-viewer")[0];
element.setAttribute("config-map", JSON.stringify(configMap))
```
## CSS
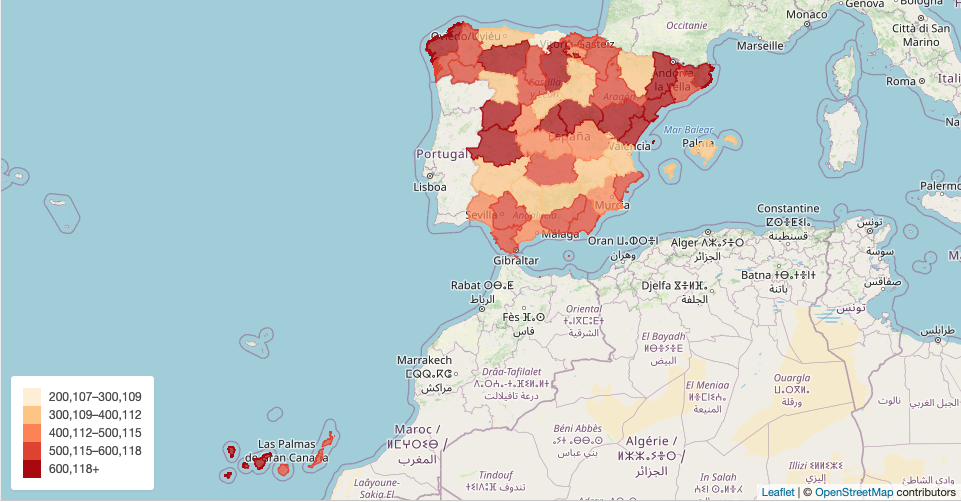
You can override the color scale using custom properties. To create color scales for maps, we recommend using [ColorBrewer](https://colorbrewer2.org/#type=sequential&scheme=BuGn&n=3)
In your CSS, you should override the custom properties that we have created.
```css
:root {
--perspective-map-range-1: #fef0d9;
--perspective-map-range-2: #fdcc8a;
--perspective-map-range-3: #fc8d59;
--perspective-map-range-4: #e34a33;
--perspective-map-range-5: #b30000;
--perspective-map-category-1: #feebe2;
--perspective-map-category-2: #fbb4b9;
--perspective-map-category-3: #f768a1;
--perspective-map-category-4: #c51b8a;
--perspective-map-category-5: #7a0177;
}
```
## Examples
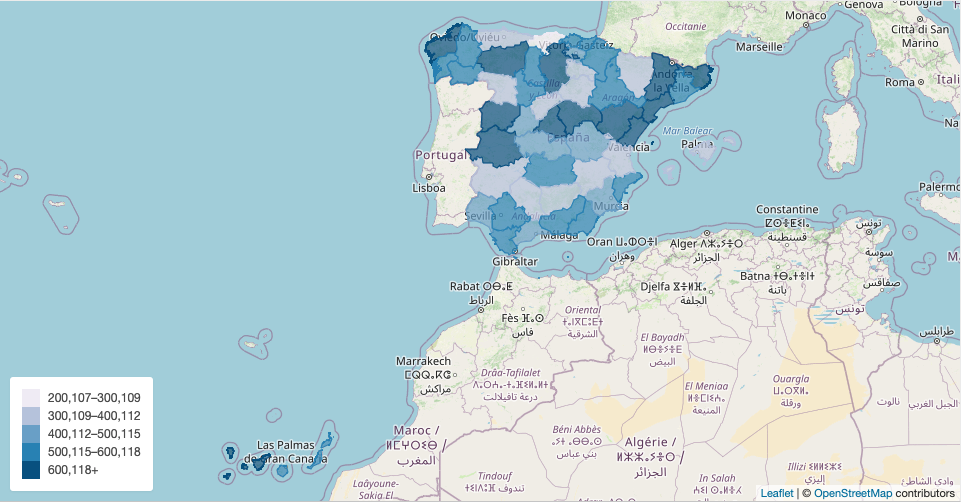
Choroplet spanish regions
Choroplet spanish regions override scale color
Map marker
Chroloplet map with Vue
## Development
- Clone the repo
- Install dependencies
- Start coding!
- Send a PR