https://github.com/pranta-barua007/microservices-typescript
Event Drive Microservice REST API using Node.js
https://github.com/pranta-barua007/microservices-typescript
bulljs ci code-sharing docker express grafana ingress-nginx k6 kube-prometheus-stack kubernetes microservices mongodb mongoose nats-streaming nextjs prometheus restful-api typescript zero-downtime
Last synced: 20 days ago
JSON representation
Event Drive Microservice REST API using Node.js
- Host: GitHub
- URL: https://github.com/pranta-barua007/microservices-typescript
- Owner: pranta-barua007
- Created: 2022-05-05T16:33:39.000Z (about 4 years ago)
- Default Branch: master
- Last Pushed: 2025-12-12T17:44:06.000Z (6 months ago)
- Last Synced: 2025-12-14T08:39:01.498Z (6 months ago)
- Topics: bulljs, ci, code-sharing, docker, express, grafana, ingress-nginx, k6, kube-prometheus-stack, kubernetes, microservices, mongodb, mongoose, nats-streaming, nextjs, prometheus, restful-api, typescript, zero-downtime
- Language: TypeScript
- Homepage:
- Size: 7.8 MB
- Stars: 4
- Watchers: 1
- Forks: 0
- Open Issues: 0
-
Metadata Files:
- Readme: README.md
Awesome Lists containing this project
README
## Event Driven Mircroservice and Monitoring using Prometheus and Grafana
An microservices app created with Express.js, Typescript, MongoDB, BullJS, Docker, Kubernernetes, Ingress-NGINX & NATS.

### Requirements
- [Docker](https://www.docker.com)
- [Kubernetes](https://kubernetes.io)
- [Skaffold](https://skaffold.dev/docs/install)
- [Helm](https://helm.sh/docs/intro/install/)
### Install Helm
To install Helm on Unix-based systems:
```shell
curl -fsSL -o get_helm.sh https://raw.githubusercontent.com/helm/helm/main/scripts/get-helm-3
chmod 700 get_helm.sh
./get_helm.sh
```
For other OS or advanced methods, visit: [Helm Installation Docs](https://helm.sh/docs/intro/install/)
## Available Commands
### Install Ingress-NGINX with metrics enabled:
Using Helm (recommended for custom configuration):
```console
helm repo add ingress-nginx https://kubernetes.github.io/ingress-nginx
helm repo update
helm install ingress-nginx ingress-nginx/ingress-nginx \
--namespace ingress-nginx --create-namespace \
--set controller.metrics.enabled=true \
--set controller.podAnnotations."prometheus\.io/scrape"="true" \
--set controller.podAnnotations."prometheus\.io/port"="10254"
```
To uninstall Ingress-NGINX:
```console
helm uninstall ingress-nginx -n ingress-nginx
kubectl delete namespace ingress-nginx
```
### Install Prometheus (Kube-Prometheus-Stack):
```console
helm repo add prometheus-community https://prometheus-community.github.io/helm-charts
helm repo update
helm install kube-prometheus prometheus-community/kube-prometheus-stack \
--namespace monitoring --create-namespace
```
### Apply monitoring configuration:
```console
kubectl apply -k infra/monitoring/
```
### Run all services in parallel (Skaffold must be installed):
To set a JSON web token secret
```console
kubectl create secret generic jwt-secret --from-literal=JWT_KEY=
```
To set a STRIPE secret (needed for `payments` service)
Create your STRIPE account and get the secret
* [stripe](https://stripe.com/docs/keys)
```console
kubectl create secret generic stripe-secret --from-literal=STRIPE_KEY=
```
Check all created secrets
```console
kubectl get secrets
```
```console
skaffold dev
```
## Developement setup
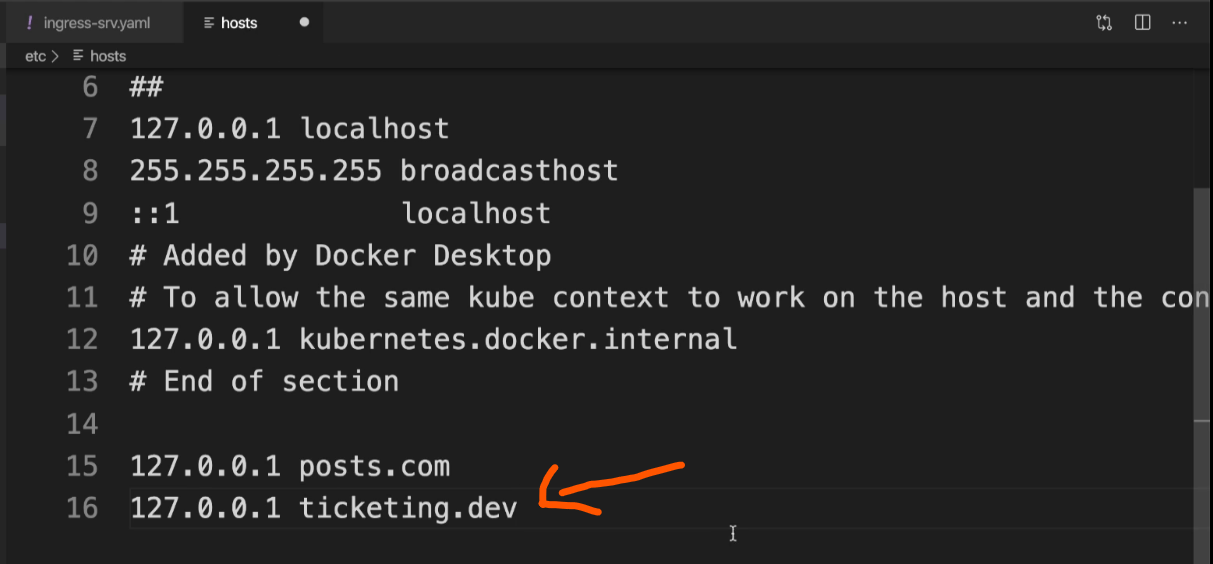
We need to edit the `host` file of our computer to identify our custom route in dev environment.
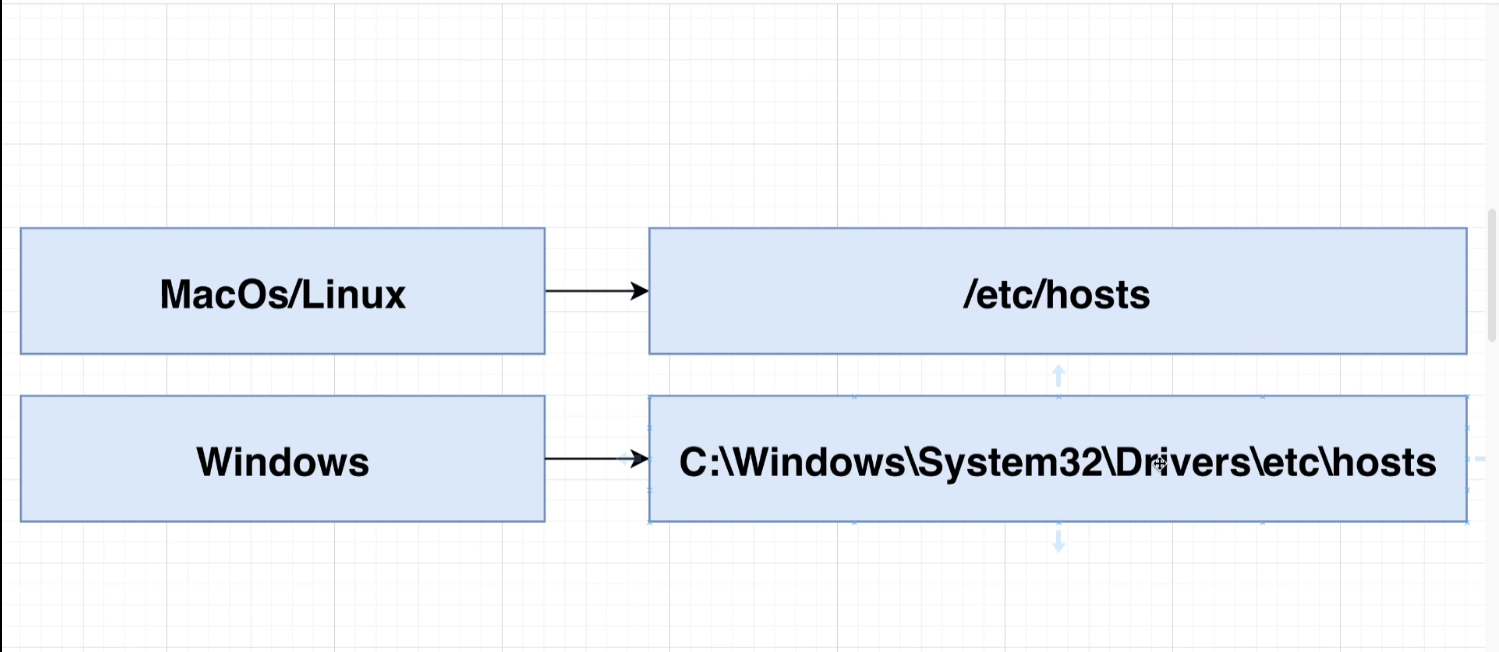
Add `127.0.0.1 ticketing.dev` to the host file
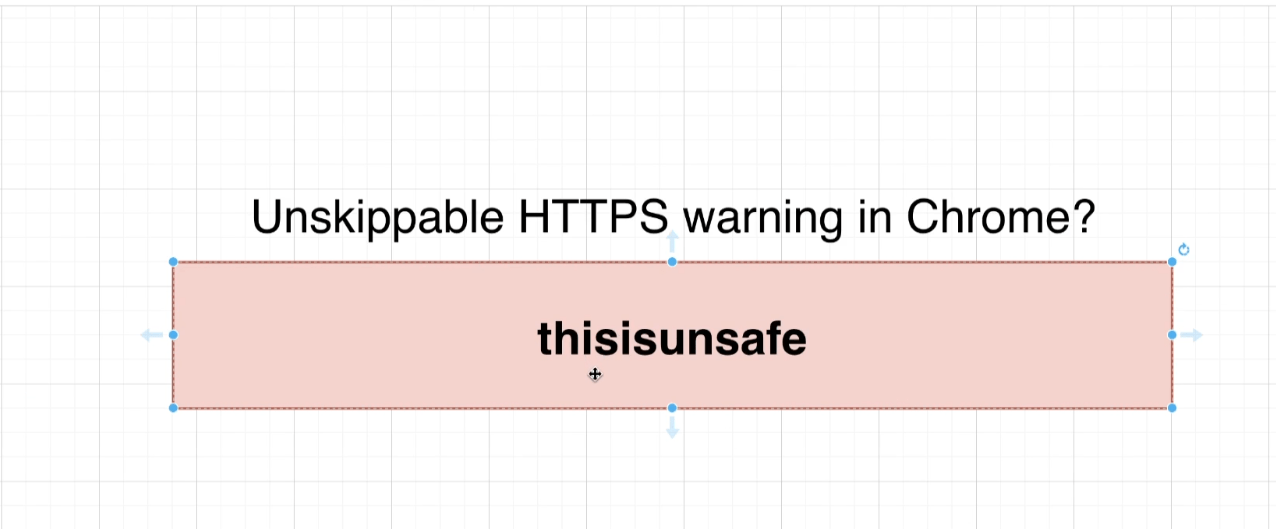
## Troubleshooting
You may face this error in `Chrome Browser` or `Chromium` based browsers

To fix the error ->
- Click on the active tab of the browser
- Type `thisisunsafe`
- The error should gone by now
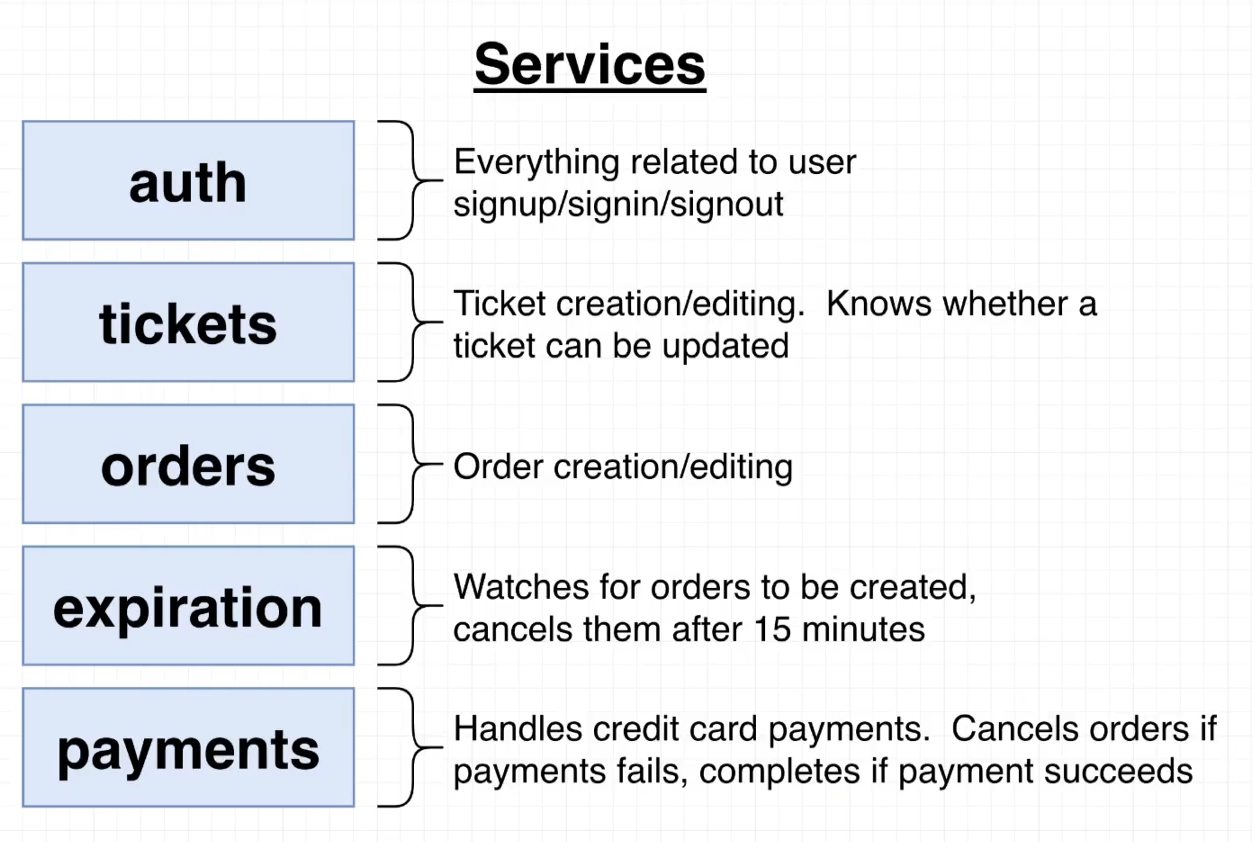
## Service's overview
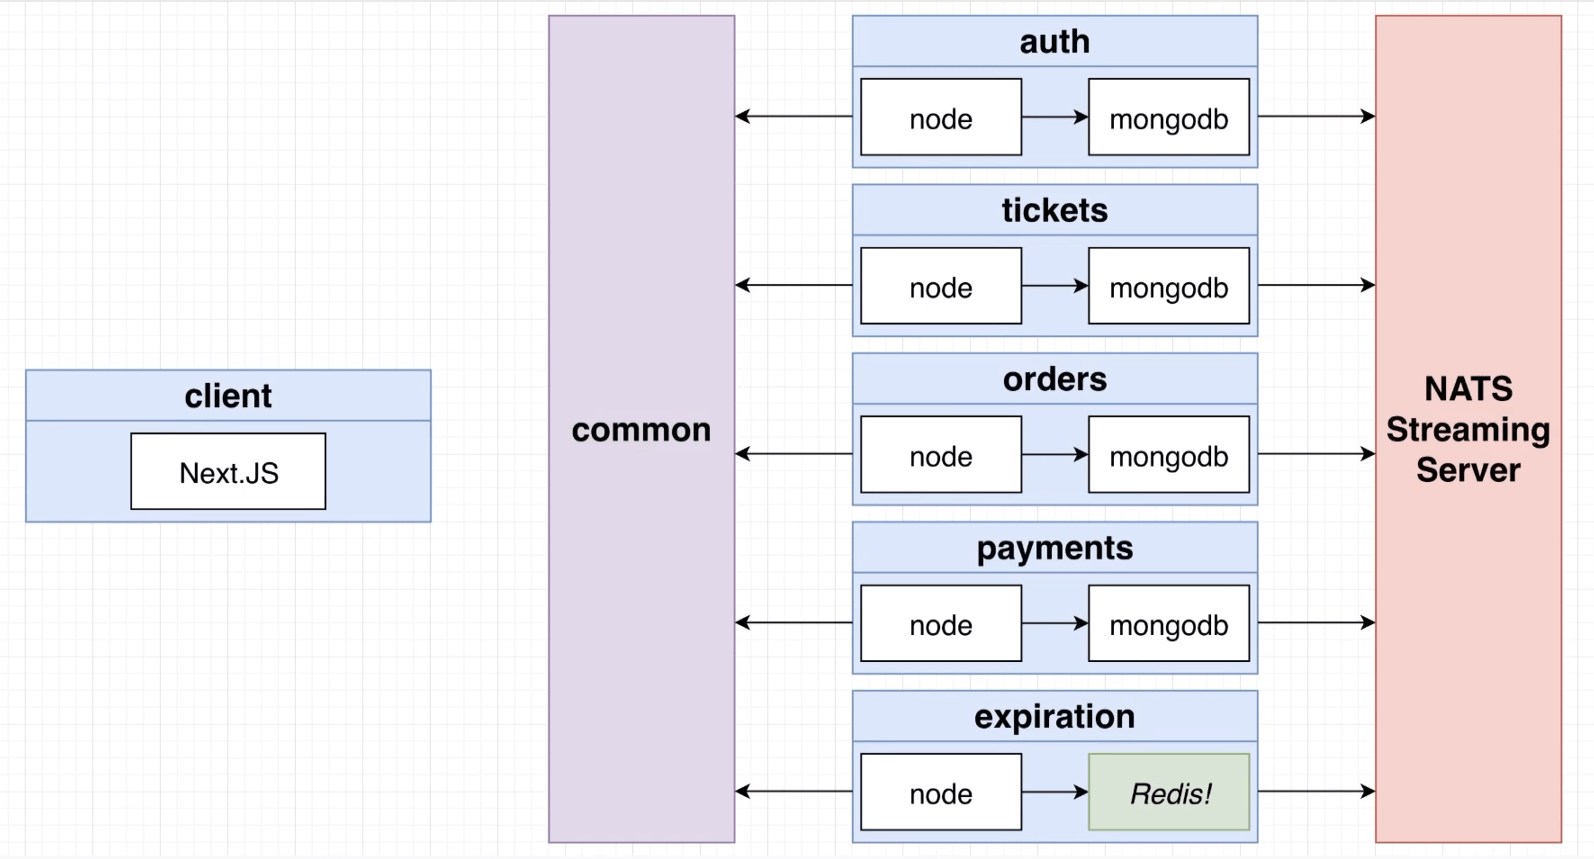
## Mircroservice Architecture
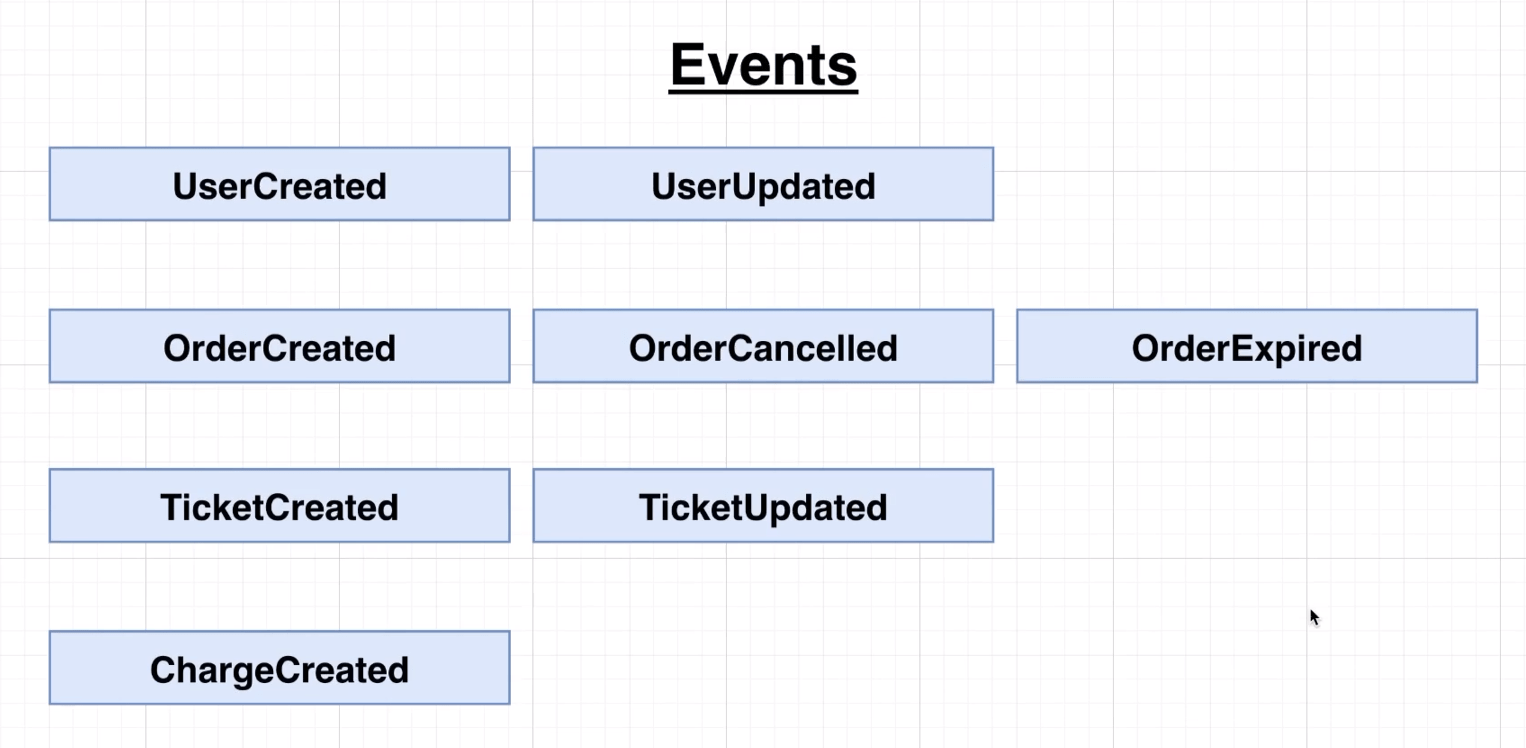
## Events for communicating between Mircroservice's through NATS
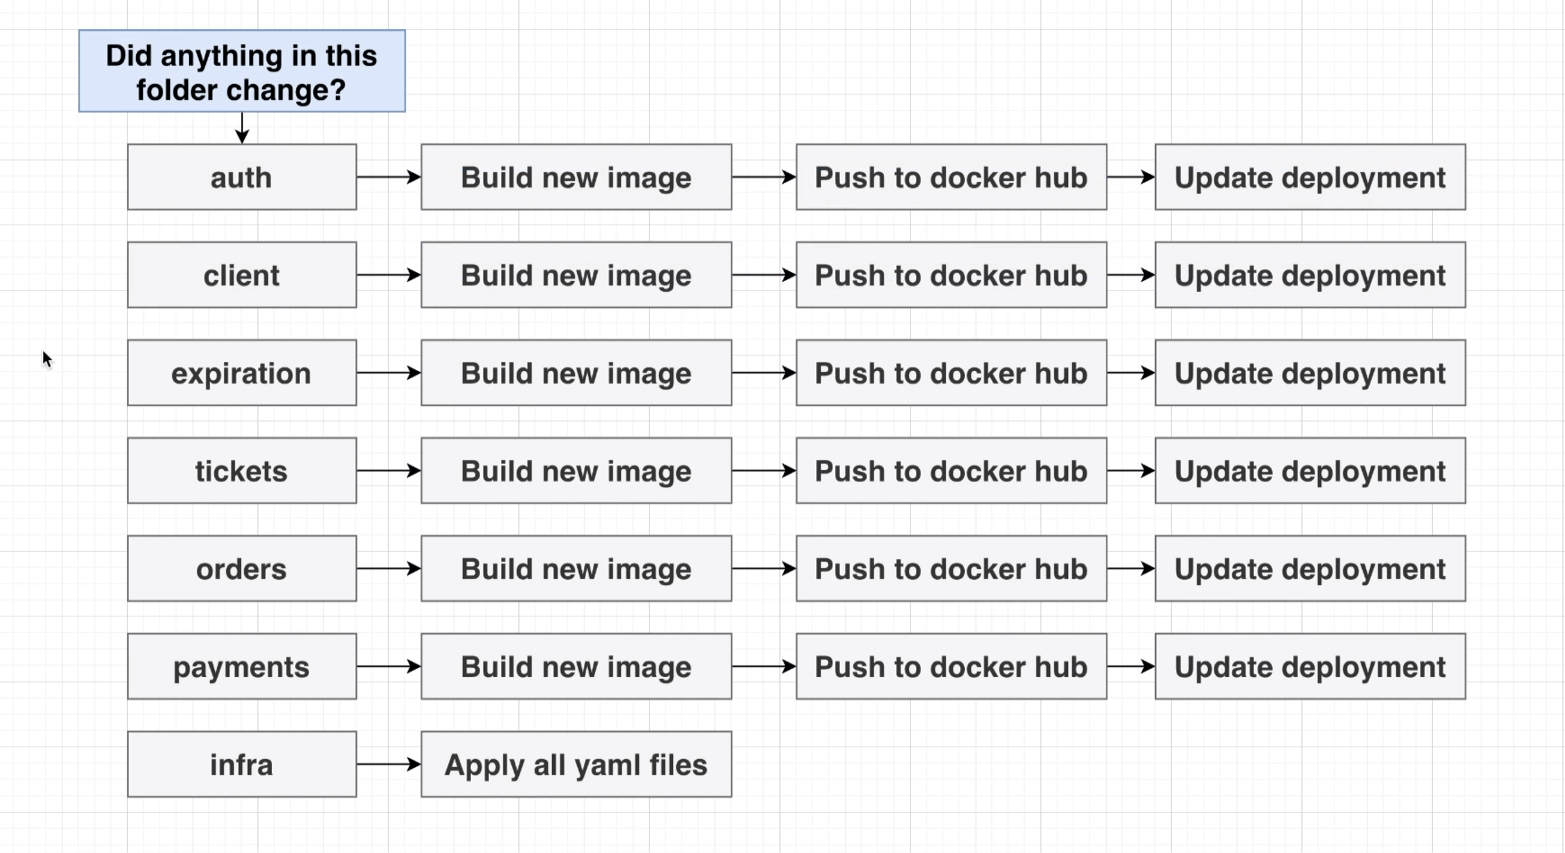
## Developement Flow
## Monitoring using Prometheus and Grafana
Services should be running on `ticketing.dev` if not start by
```console
skaffold dev
```
Apply config to monitoring services
```console
kubectl apply -k infra/monitoring/
```
Expose Ingress-NGINX Metrics
```console
kubectl port-forward -n ingress-nginx svc/ingress-nginx-controller-metrics 10254:10254
```
access Ingress-NGINX Metrics on `http://localhost:10254/metrics`
Expose Prometheus Metrics
```console
kubectl port-forward svc/kube-prometheus-kube-prome-prometheus -n monitoring 9090:9090
```
access Prometheus on `http://localhost:9090/targets`
Expose Grafana Dashboard
```console
kubectl port-forward svc/kube-prometheus-grafana -n monitoring 8080:80
```
access Grafana Dashboard on `http://localhost:8080`
Grafana Login credentials
```console
username: admin
password: prom-operator
```
### Troubleshoot
- If you see errors like namespace not found, ensure the `monitoring` namespace exists:
```console
kubectl create namespace monitoring
```
- if unable to expose any monitoring service findout their correct names by
```console
kubectl get svc -n monitoring
```
### Performance Testing
Oha istallation
```console
cargo install oha
```
Run performance testing
```console
chmod +x perf-tests/oha/*.sh
```
Example
```bash
bash perf-tests/oha/spike-test.sh
```