https://github.com/prateekiiest/a-novel-clustering-approach
A a new approach to clustering the IRIS dataset
https://github.com/prateekiiest/a-novel-clustering-approach
cluster-analysis clustering clustering-algorithm correlation iris machine-learning machine-learning-algorithms
Last synced: 9 months ago
JSON representation
A a new approach to clustering the IRIS dataset
- Host: GitHub
- URL: https://github.com/prateekiiest/a-novel-clustering-approach
- Owner: prateekiiest
- License: gpl-2.0
- Created: 2018-09-29T00:30:59.000Z (about 7 years ago)
- Default Branch: master
- Last Pushed: 2018-09-30T01:05:00.000Z (about 7 years ago)
- Last Synced: 2025-01-12T15:31:33.328Z (10 months ago)
- Topics: cluster-analysis, clustering, clustering-algorithm, correlation, iris, machine-learning, machine-learning-algorithms
- Language: Python
- Homepage:
- Size: 223 KB
- Stars: 2
- Watchers: 3
- Forks: 0
- Open Issues: 0
-
Metadata Files:
- Readme: README.md
- License: LICENSE
Awesome Lists containing this project
README
# A Novel Approach to Clustering
## Abstract
Clustering is one of the most important topics under machine learning and is used to find potential structure in the data, how the data items are similar to each other.Clustering is a method of unsupervised learning and is a common technique for statistical data analysis used in many fields.
In Data Science, we can use clustering analysis to gain some valuable insights from our data by seeing what groups the data points fall into when we apply a clustering algorithm.
Here we propose a new clustering approach to gather data points that are highly similar to each other into one cluster and separate the points that are highly dissimilar in nature.
## Data Set
We use the iris data set in our case to evaluate our model in this respect.
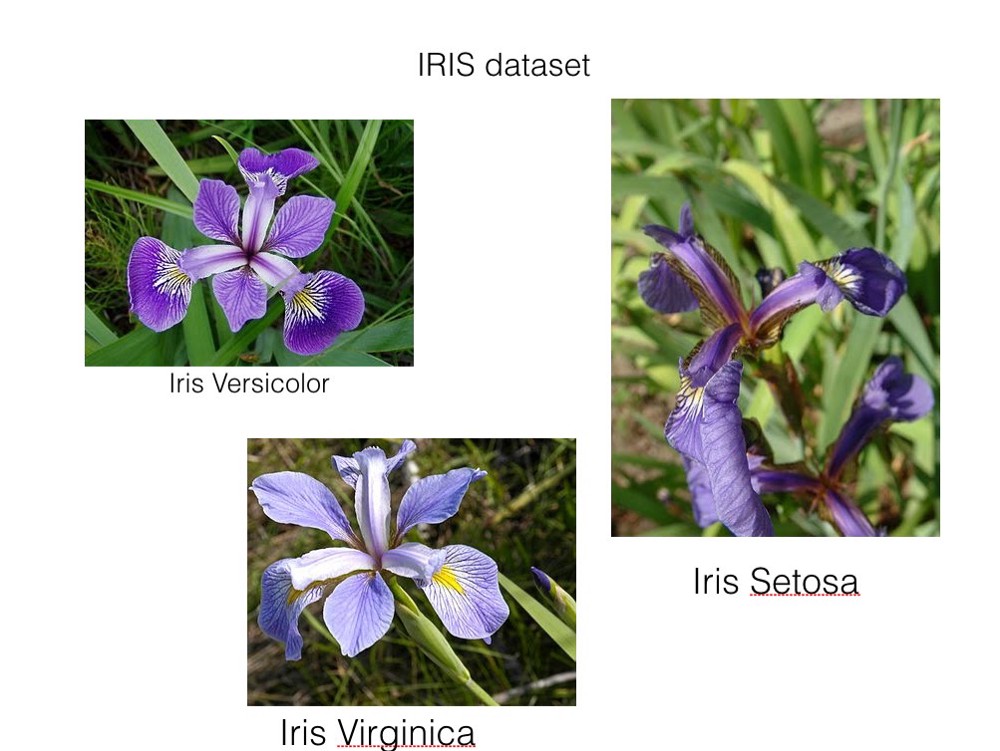
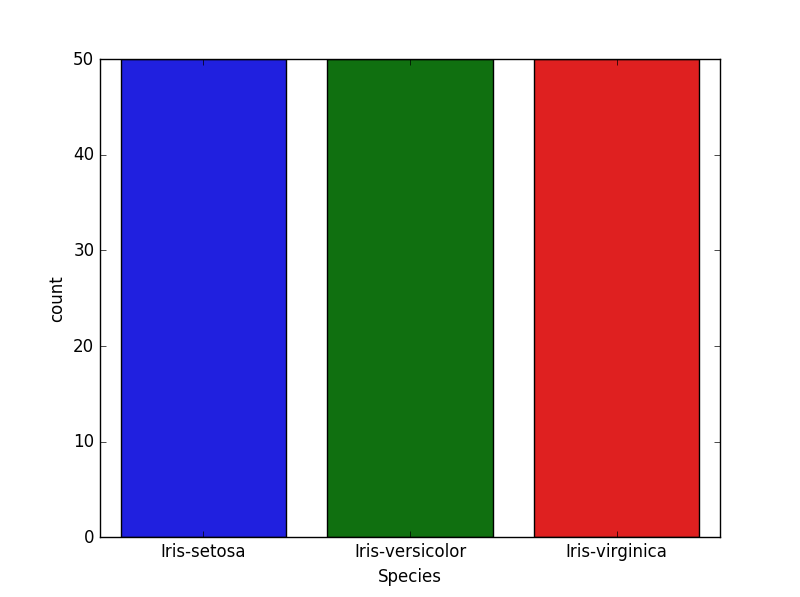
- The data set consists of 50 samples from each of three species of Iris (Iris setosa, Iris virginica and Iris versicolor). Four features were measured from each sample: the length and the width of the sepals and petals, in centimetres.
- The data set contains 150 observations of iris flowers. There are four columns of measurements of the flowers in centimeters. The fifth column is the species of the flower observed. All observed flowers belong to one of three species.

### DataSet visualization
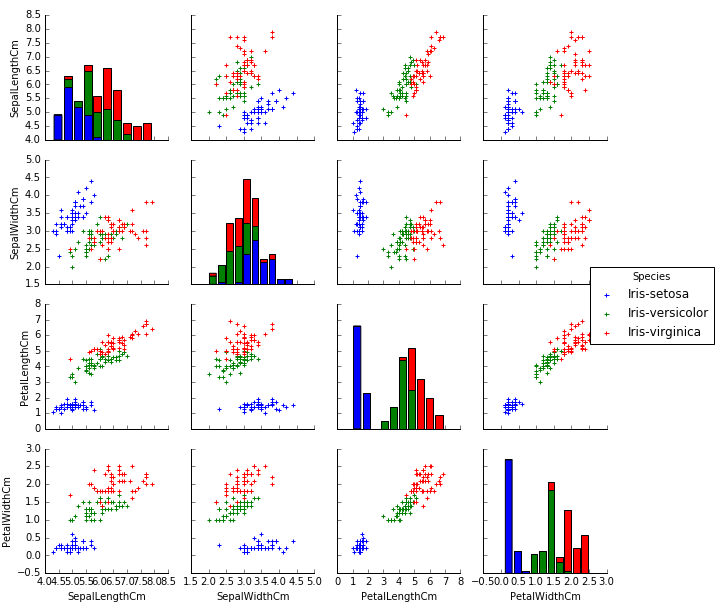
So we first make the data visualization of the data set
#### Feature Plot
```
import pandas as pd
import matplotlib.pyplot as plt
wbcd = pd.read_csv('iris_new.csv')
tmp = wbcd.drop('Id', axis=1)
g = sns.pairplot(tmp, hue='Species', markers='+')
plt.show()
```

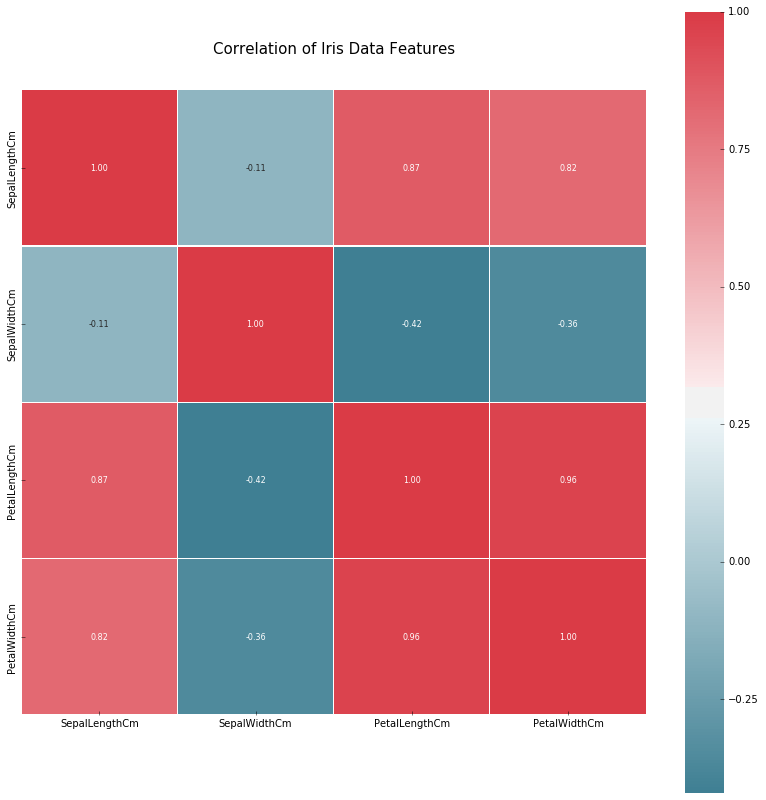
#### Feature Correlation
We then see the correlation among the features of the data set.
```
corr = tmp.iloc[:,:].corr()
colormap = sns.diverging_palette(220, 10, as_cmap = True)
plt.figure(figsize=(14,14))
sns.heatmap(corr, cbar = True, square = True, annot=True, fmt= '.2f',annot_kws={'size': 8},
cmap = colormap, linewidths=0.1, linecolor='white')
plt.title('Correlation of Iris Data Features', y=1.05, size=15)
plt.show()
```

#### Class Distribution
```
tmp = wbcd.drop('Id', axis=1)
sns.countplot(tmp['Species'],label="Count")
plt.show()
```

----------------------------------
## Clustering Approach
We know move on to our new clustering approach proposed.
The clustering algorithm proposed is as follows
- We initially have 150 clusters initialised by the object iteself, such as c_1, c_2,..........,c_150
- For every pair of clusters c_i and c_j, compute cluster similarity using
s_ij = | c_i ∩ c_j | / | c_i u c_j |
- Thus you have a cluster similarity matrix S = (s_ij)
If s_kl is the highest value in S then merge clusters c_k and c_l .
If multiple highest values are there separately merge them
- If any cluster say c_t (≠ c_k and c_l) is a subset of (c_k u c_l) then discard it for all t = 1,2,...,150
t≠k and t≠l
Let c_d = number of clusters discarded
- Let you have n = 150 - c_d - 1
- If no. of clusters = m(predefined, user input) then return else goto step 2