https://github.com/precise-simulation/matlab-octave-web-interface
Web server and interface for Matlab and Octave
https://github.com/precise-simulation/matlab-octave-web-interface
interface matlab octave plotly server web
Last synced: about 1 year ago
JSON representation
Web server and interface for Matlab and Octave
- Host: GitHub
- URL: https://github.com/precise-simulation/matlab-octave-web-interface
- Owner: precise-simulation
- License: agpl-3.0
- Created: 2022-05-09T13:19:18.000Z (about 4 years ago)
- Default Branch: main
- Last Pushed: 2022-05-09T13:25:46.000Z (about 4 years ago)
- Last Synced: 2025-04-01T02:52:54.269Z (over 1 year ago)
- Topics: interface, matlab, octave, plotly, server, web
- Language: MATLAB
- Homepage:
- Size: 913 KB
- Stars: 5
- Watchers: 3
- Forks: 0
- Open Issues: 0
-
Metadata Files:
- Readme: README.md
- License: LICENSE
Awesome Lists containing this project
README
A Web Browser Interface and Server for Matlab and Octave
========================================================
About
-----
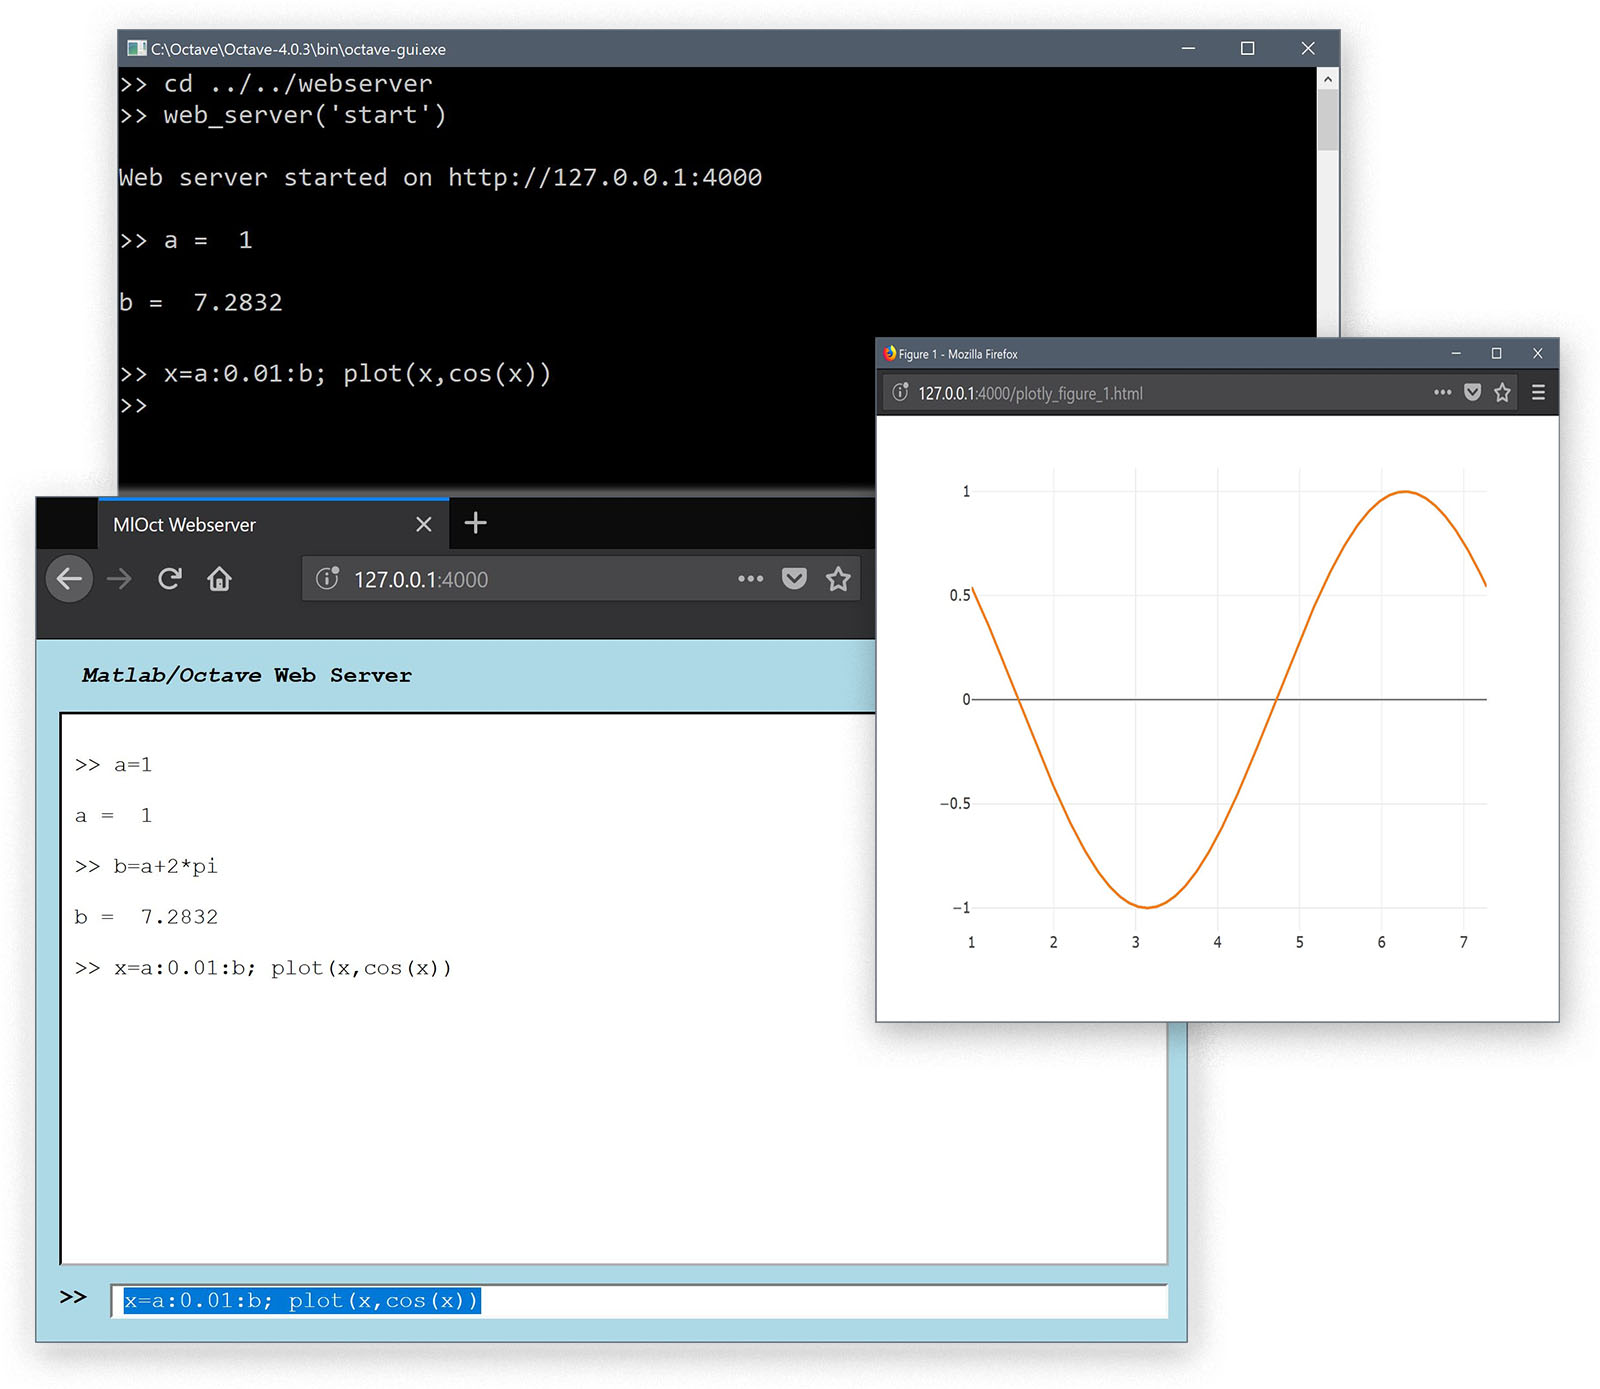
A simple experimental web browser interface for Matlab and Octave.
Running the web_server('start') command starts a local
_TCP_ and _web_ server and opens a connected web browser window which
accepts Matlab and Octave commands as input. Plots are translated via
the Plotly Javascript library into Html graphs.
Installation
------------
Download the _webserver_ archive and extract the contents in a
convenient folder.
Requirements
------------
1. A modern [web browser](https://www.mozilla.org/en-US/firefox)
with Javascript enabled and flexbox CSS support.
2. [Matlab](https://www.mathworks.com/matlab) or
[Octave](https://www.gnu.org/software/octave) installed.
3. [Java](http://www.oracle.com/technetwork/java/javase/downloads)
installed and support enabled with Matlab and Octave.
Usage
-----
Simply change to the extracted folder or add it to the Matlab/Octave
paths and run the command
web_server( 'start' )
to start the web server and open the mirrored Matlab/Octave session in
the default web browser. To stop the sever run the command
web_server( 'stop' )
To see the available options enter
help web_server
help tcp_server
Known Issues
------------
1. The Plotly library needs further improvements to fully support
Octave (currently only line plots are supported). The main issue is
that a lot of struct calls in the Plotly conversion function are
accessed as _s.Color_ or _s.XLabel_ where in Octave the fields are
all in lower case, that is _s.color_ and _s.xlabel_.
Credits
-------
[1] [Matlab Webserver by Dirk-Jan Kroon](https://www.mathworks.com/matlabcentral/fileexchange/29027-web-server)
[2] [Plotly Javascript library](https://plot.ly/javascript)
Software License
----------------
[GNU Affero General Public License AGPL](https://www.gnu.org/licenses/agpl-3.0.txt)