https://github.com/preignition/multi-chart
lit-element building blocks for charts and visualization (based on d3.js v5)
https://github.com/preignition/multi-chart
analytics chart d3 d3v4 dataviz polymer
Last synced: 11 months ago
JSON representation
lit-element building blocks for charts and visualization (based on d3.js v5)
- Host: GitHub
- URL: https://github.com/preignition/multi-chart
- Owner: preignition
- Created: 2016-10-08T10:10:08.000Z (almost 10 years ago)
- Default Branch: master
- Last Pushed: 2023-10-16T21:20:22.000Z (over 2 years ago)
- Last Synced: 2024-12-11T09:27:38.327Z (over 1 year ago)
- Topics: analytics, chart, d3, d3v4, dataviz, polymer
- Language: JavaScript
- Homepage: https://webcomponents.org/element/polymerEl/multi-chart
- Size: 7.37 MB
- Stars: 25
- Watchers: 3
- Forks: 1
- Open Issues: 7
-
Metadata Files:
- Readme: README.md
- Changelog: CHANGELOG.md
Awesome Lists containing this project
README
[](https://app.netlify.com/sites/multi-chart/deploys)
# \
Build composable, markup-based, extensible visualizations for the web.
\ is a [lit-element](https://github.com/polymer/lit-element)-based library to compose markup-driven and data-driven vizualization layers.
## Motivation
While building vizualisation for the web, it is difficult to find the right balance between low-level vizualization kernel (like d3) that requires a lot of development work, and high-level black box library that are difficult to configure beyond a certain point.
\ is a attempt to provide the best of two the worlds: low level extensible webcomponents (often wrapper around d3.js modules like d3-axis) composed together to build complex charts. The library proposes ready-to-use configurable charts, but also the building blocks for accomodating more complex use case.
This library plays well with [\](https://github.com/preignition/multi-geo) (similar library for geo charts like choropleth) and [\](https://github.com/preignition/multi-verse), a graphical interactive multi-dimensional analysis tool. Together, they offer a markup-based alternative to tools like [dc.js](https://dc-js.github.io/dc.js/).
## Demo and API
Demo and API are now available on [netlify](https://multi-chart.netlify.com/).
## Examples
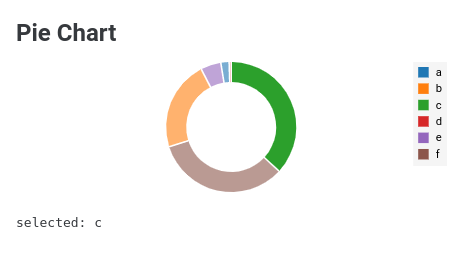
### Pie
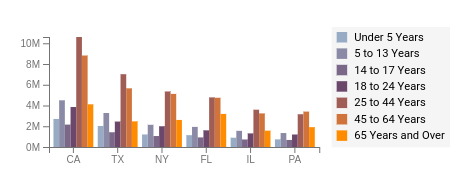
### Bar
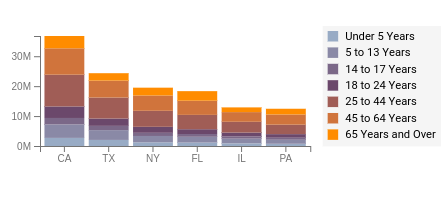
### Stack
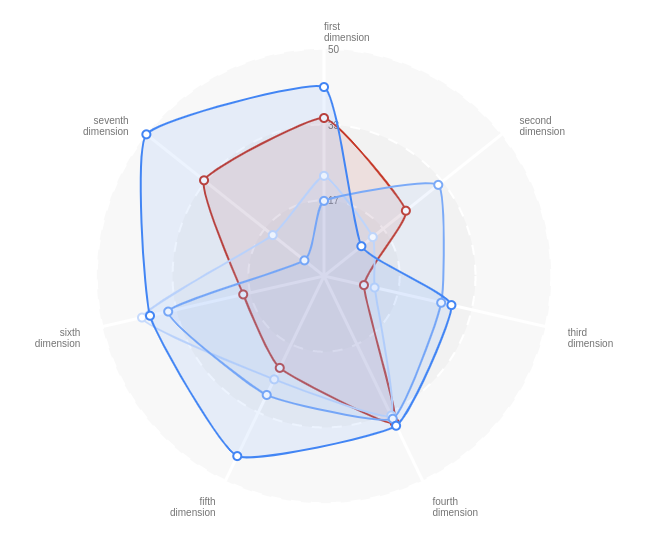
### Radar
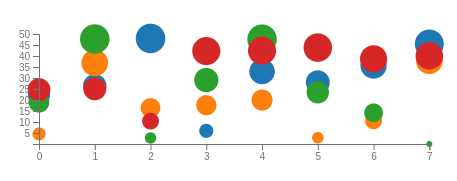
### Bubble