https://github.com/preignition/multi-verse
lit-element components for fast and modular multivariate analysis
https://github.com/preignition/multi-verse
analytics chart crossfilter d3 d3v4 dataviz multivariate-analysis polymer-element universe
Last synced: 6 months ago
JSON representation
lit-element components for fast and modular multivariate analysis
- Host: GitHub
- URL: https://github.com/preignition/multi-verse
- Owner: preignition
- License: other
- Created: 2016-10-11T05:13:16.000Z (almost 10 years ago)
- Default Branch: master
- Last Pushed: 2021-08-04T14:24:19.000Z (almost 5 years ago)
- Last Synced: 2025-04-18T16:57:20.482Z (over 1 year ago)
- Topics: analytics, chart, crossfilter, d3, d3v4, dataviz, multivariate-analysis, polymer-element, universe
- Language: JavaScript
- Homepage: https://www.webcomponents.org/element/PolymerEl/multi-verse
- Size: 15.6 MB
- Stars: 36
- Watchers: 5
- Forks: 0
- Open Issues: 1
-
Metadata Files:
- Readme: README.md
- Changelog: CHANGELOG.md
- License: LICENSE
Awesome Lists containing this project
README
[](https://webcomponents.org/element/polymerEl/multi-verse)
[](https://app.netlify.com/sites/multi-verse/deploys)
# \
Polymer elements for graphical and interactive multivariate analysis (built on top of [universe](https://github.com/crossfilter/universe)) and using [d3.js V5](https://github.com/d3/d3), [crossfilter](https://github.com/crossfilter/crossfilter) and [reductio](https://github.com/crossfilter/reductio) under the hood.
Charts are rendered using [multi-chart](https://github.com/PolymerEl/multi-chart), or [multi-geo](https://github.com/PolymerEl/multi-chart) for geo charts like choropleth. They are data driven and reactive, providing instant feedback to user interaction.
## Motivation
Multi-verse is inspired by [dc.js](http://dc-js.github.io/dc.js/), a charting library allowing highly efficient exploration on large multi-dimensional datasets.
While `dc.js` requires users to code some of the chart logic and data intagration in javascript, `multi-verse` proposes a markup-first approach. This allows to build complex dashboard simply by combining `multi-verse` and `multi-chart` web components together, as illustrated in the example below.
`Multi-verse` components leverages `crossfilter` and are responsible for data management (aggregation, sorting, grouping), while `multi-charts` components render processed data in customizable visulalizations.
## Demo and API
Demo and API are now available on [netlify](https://multi-verse.netlify.com/).
## Simple Example
```html
```
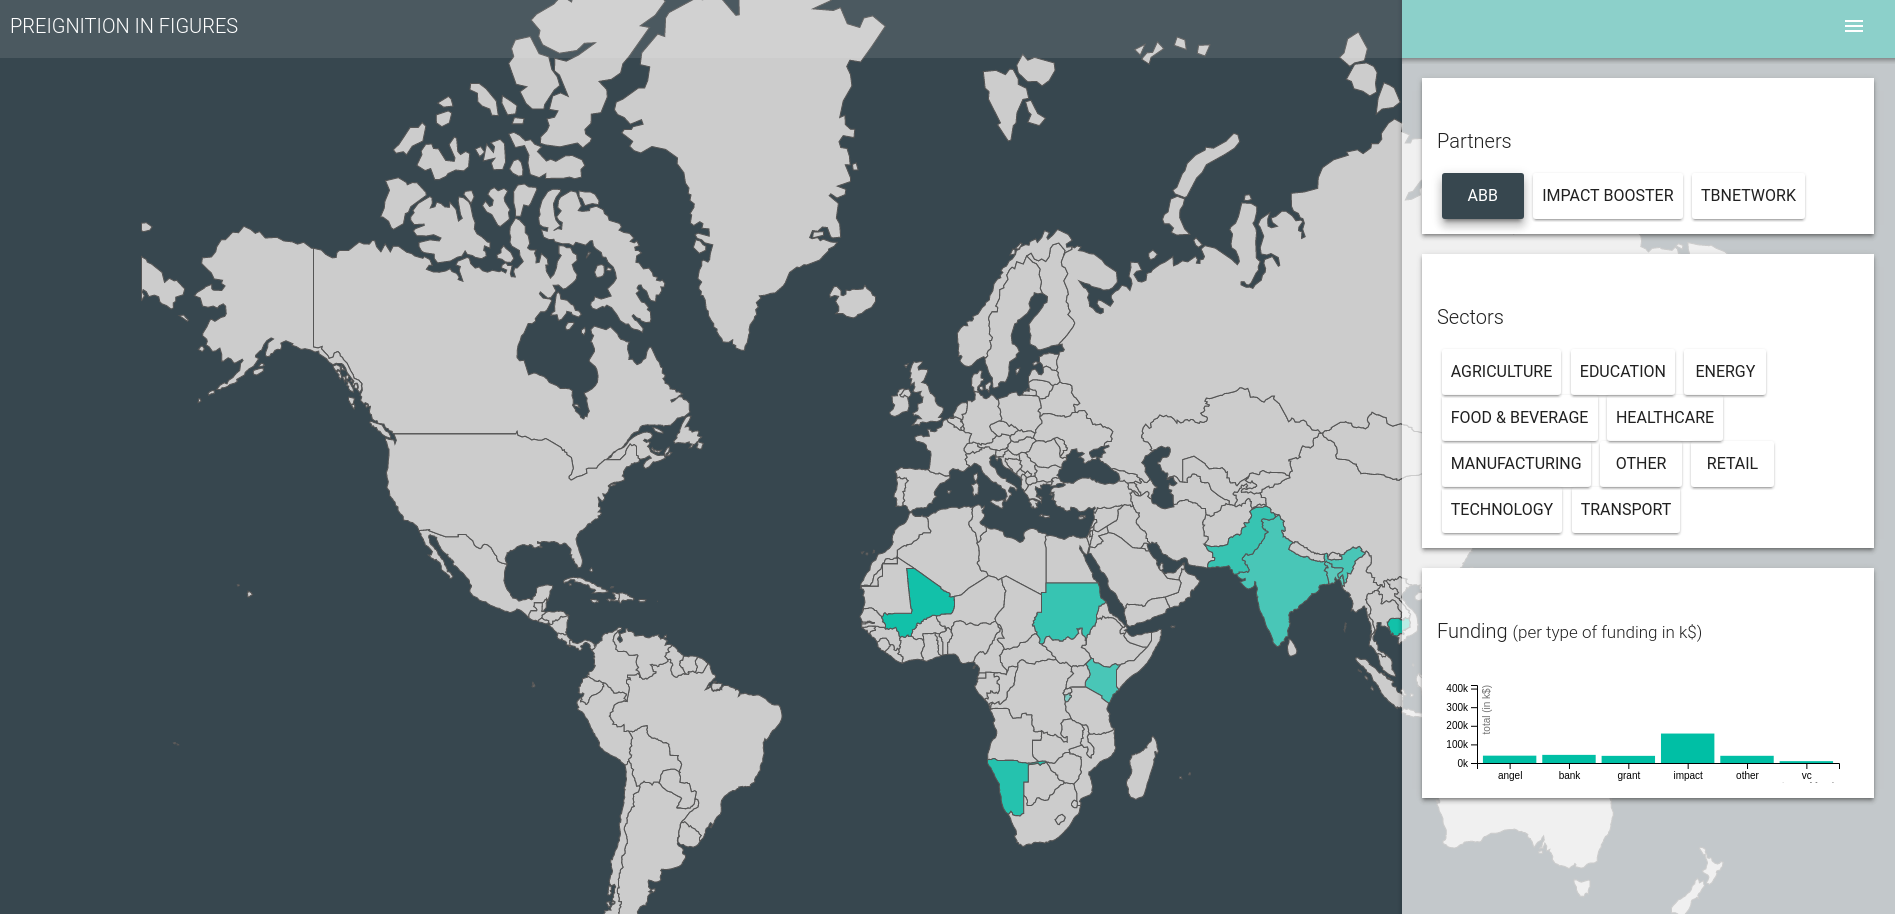
## Example of multi-verse in a interactive dashboard
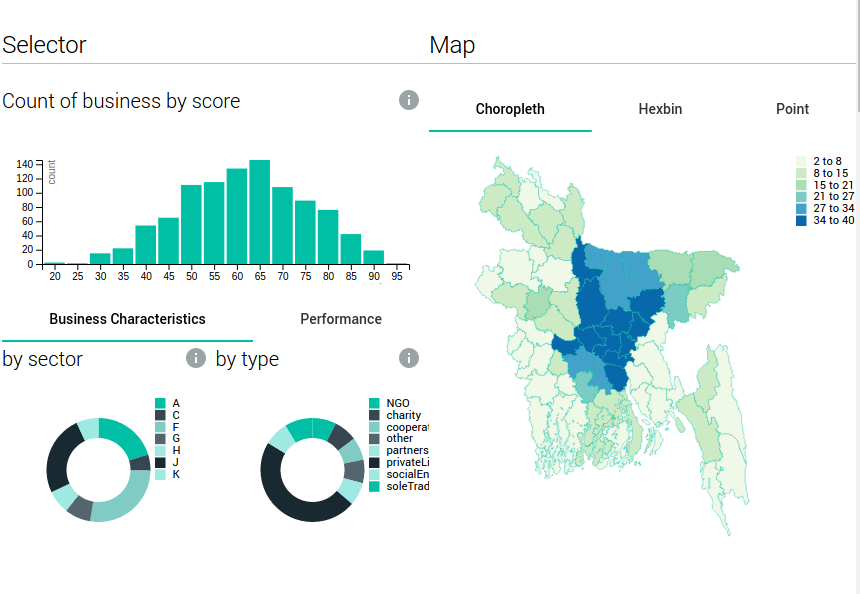
## Other advanced example - available from the demo