https://github.com/ptyadana/tableau_2020_a-z_hands-on
Tableau Projects for data analysis, data analytics and data visualaization on different data sets
https://github.com/ptyadana/tableau_2020_a-z_hands-on
data-analysis data-science data-visualization tableau tableau-dashboards tableau-desktop tableau-public tableau-workbooks
Last synced: 3 months ago
JSON representation
Tableau Projects for data analysis, data analytics and data visualaization on different data sets
- Host: GitHub
- URL: https://github.com/ptyadana/tableau_2020_a-z_hands-on
- Owner: ptyadana
- License: mit
- Created: 2020-06-15T10:30:39.000Z (over 5 years ago)
- Default Branch: master
- Last Pushed: 2020-06-18T15:39:35.000Z (over 5 years ago)
- Last Synced: 2025-01-15T15:54:08.647Z (9 months ago)
- Topics: data-analysis, data-science, data-visualization, tableau, tableau-dashboards, tableau-desktop, tableau-public, tableau-workbooks
- Homepage: https://public.tableau.com/profile/phonethiriyadana#!/
- Size: 8.13 MB
- Stars: 12
- Watchers: 3
- Forks: 5
- Open Issues: 0
-
Metadata Files:
- Readme: readme.md
- License: LICENSE
Awesome Lists containing this project
README
# About The Project
Compilation of Tableau projects for data analysis, data analytics and data visualization.
## Built with
+ Tableau Desktop
## Live Demo
+ [view Project Details on Tableau Public](https://public.tableau.com/profile/phonethiriyadana#!/vizhome/Tableau2020A-ZHands-OnTableauTrainingForDataScienceProjects/Tableau2020A-ZHands-OnTableauTrainingForDataScienceProjects)
## Datasets
+ [Practice Datasets](https://www.superdatascience.com/pages/tableau)
## Analyzing the following datasets
+ SuperStore
+ Office Supplies
+ Long-Term-Unemployment-Statistics
+ Amazing Mart EU
+ Airline-Comparison
+ UK Bank Customers
+ Personal Vehicle SalesGlobal
## For exploring the following questions and points.
Super Store
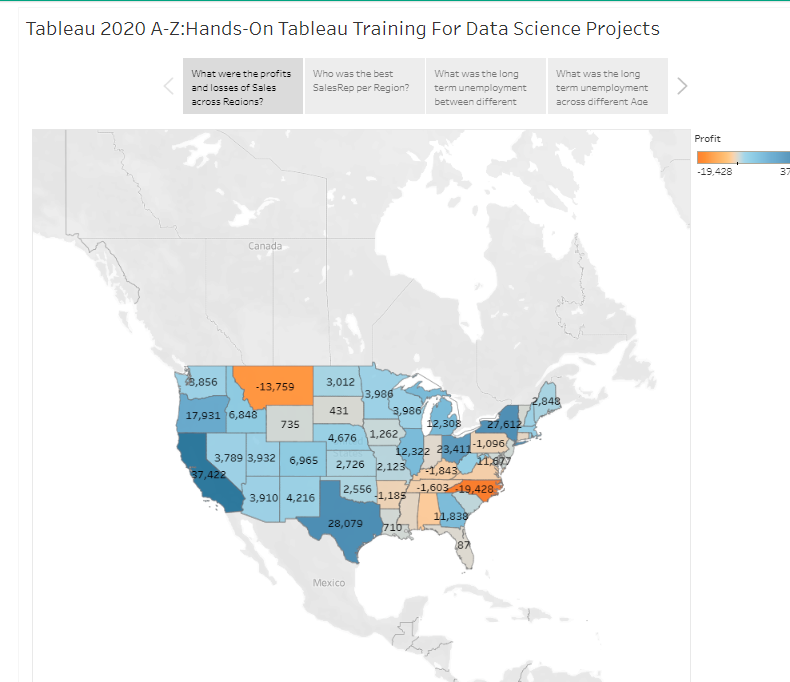
+ Profits by States : What were the profits and losses of Sales across Regions?
+ Total Sales by SalesRep: Who was the best SalesRep per Region? This is for Annual Bonus Analysis.
US Unemployment Data
+ US Unemployment by Gender : What was the long term unemployment between different Genders?
+ US Unemployment by Age Groups : What was the long term unemployment across different Age Groups?
----
Amazing Mart EU
+ Profit Margin by Countries: What was the profit margin for countries over year?
+ Profit Margin per Customer: What was the profit margin per each customer?
+ Profit Margin Dashboard
----
Airline Data
+ Airlines Revenue Comparison: What were the revenues for two different airlines?
+ Sales Vs Target by Categories : What are Sales Vs Target by each Category?
+ Excess of Target by Category : Which Category exceeds or short of Target Sales?
----
UK Bank Customers
+ UK Bank Customers - Gender Distribution
+ UK Bank Customers - Age Distribution
+ UK Bank Customers - Balance Distribution
+ UK Bank Customers - Job Classifications
+ UK Bank Customer Dashboard
+ Insights for UK Bank Customer represented with Storyline.
+ Popularity of Bank by % of customer by region?
+ Which region of customer are richest?
+ Are customer white color job wealthier than blue or other color jobs?
+ Which Region comes the wealthier customer?
----
Laundry Pick up service startup
+ Identify which of the two sales regions is performing better (outperforms the other in 2 of 3 metrics)
+ a) AVG Revenue per city
+ b) AVG Marketing spend per city (less is better)
+ c) AVG ROMI per city (revenue / marketing spend)
+ Identify which of the 10 new locations have the best potential for the company to invest more funds into marketing.
----
+ New York City Park & Incidents Analysis
----
New York State Salary Analysis
+ Average Annual Salary by County dispalyed on a map
+ Top 5 highest earning industries by County
+ Time series analysis of average annual salary by County
## Acknowledgements
+ [Tableau 2020 A-Z:Hands-On Tableau Training For Data Science!](https://www.udemy.com/course/tableau10/)
## License
This project is licensed under the MIT License - see the [LICENSE.md](LICENSE.md) file for details