https://github.com/publiclab/leaflet-blurred-location-display
A library to display points which have been "blurred" for privacy with leaflet-blurred-location
https://github.com/publiclab/leaflet-blurred-location-display
javascript leaflet maps privacy
Last synced: 4 months ago
JSON representation
A library to display points which have been "blurred" for privacy with leaflet-blurred-location
- Host: GitHub
- URL: https://github.com/publiclab/leaflet-blurred-location-display
- Owner: publiclab
- License: gpl-3.0
- Created: 2017-08-20T07:52:47.000Z (almost 9 years ago)
- Default Branch: main
- Last Pushed: 2023-01-11T22:22:18.000Z (over 3 years ago)
- Last Synced: 2025-10-29T06:39:32.740Z (8 months ago)
- Topics: javascript, leaflet, maps, privacy
- Language: JavaScript
- Homepage: https://publiclab.github.io/leaflet-blurred-location-display/examples/index.html
- Size: 12.4 MB
- Stars: 11
- Watchers: 2
- Forks: 12
- Open Issues: 35
-
Metadata Files:
- Readme: README.md
- License: LICENSE
Awesome Lists containing this project
README
leaflet-blurred-location-display (LBLD)
====
[](https://travis-ci.org/publiclab/leaflet-blurred-location-display) [](https://badge.fury.io/js/leaflet.blurred-location-display) [](https://www.gnu.org/licenses/gpl-3.0) [](http://standardjs.com)
`leaflet-blurred-location-display` is an extension of `leaflet-blurred-location` and does the following:
* Cleverly dispays "blurred" locations, keeping privacy settings in mind.
* Presents collections of blurred locations in a heatmap.
* Optionally color codes the markers on the map according to the precision.
* Fetches data from remote API or you may pass array of coordinates directly into LBLD API (see example below)
# Demo
1. See how markers are filtered at different zoom levels :
https://publiclab.github.io/leaflet-blurred-location-display/examples/example.html
2. See how markers are fetched from remote/external API :
https://publiclab.github.io/leaflet-blurred-location-display/examples/index.html
3. This page shows how different zoom levels and different precisons corresponds to different Human Readable blurring :
https://publiclab.github.io/leaflet-blurred-location-display/examples/HumanReadableBlurring.html
4. This page shows the style : heatmap property of this library which results in only colored grids without any markers :
https://publiclab.github.io/leaflet-blurred-location-display/examples/simpleHeatmapStyle.html
# Setting up leaflet-blurred-location-display
To set up the library first clone this repo to your local after that run 'npm install' to install all the neccessary packages required.
Link to npm : https://www.npmjs.com/package/leaflet.blurred-location-display
# Some terms used
* LBLD = `leaflet-blurred-location-display`
* LBL = `leaflet-blurred-location`
* remote markers = markers made from external API .
* local markers = markers made from static data provided directly into LBLD API .
* precision = number of digits after decimal .
* JSONparser = a function defined by User to parse external API .
* `zoom_level` = the current zoom level of the map .
# Options
## Basic
#### Define standard leaflet map object :
```js
var map123 = L.map('map').setView([23,77] , 3) ; // There should be a div with id = 'map' .
```
#### Define the LBL object :
See https://github.com/publiclab/leaflet-blurred-location for more details
```js
var BlurredLocation = new BlurredLocation();
blurredLocation.addTo(map123) ;
```
#### Define LBLD object :
```js
var blurredLocationDisplay = new BlurredLocationDisplay(options_display) ;
```
You need to pass some LBLD settings in the `options_display` object above , which are explained in the next section :
#### Various fields in `options_display` :
```js
var options_display = {
blurredLocation: BlurredLocation,
locations: locations,
source_url: "https://publiclab.org/api/srch/nearbyPeople",
JSONparser: JSONparser,
zoom_filter: zoom_filter,
color_code_markers: false, // by default this is false .
style: 'both' // or 'heatmap' or 'markers' , by default is 'both'
}
```
* `blurredLocation` : This is compulsory field , you have to pass the LBL object here .
* `locations` : You can pass some local data directly to LBLD API in the form of array .
* `source_url`: URL to external API to fetch data and show on map .
* `JSONparser`: JSON parser function for your API URL provided .
* `popupDisplay`: Function to build the display for the marker popup content .
* `zoom_filter` : An array signifying the range of zoom levels where particular precision markers should be visible .
* `color_code_markers` : If `true` , then markers would be color coded according to the precision of its coordinates .
* `style` : can be `both` where markers and heatmap both are drawn , `markers` for showing only markers and `heatmap` for showing only heatmap .
All these parameters are explained in detail below :
#### There are 2 ways to show data using LBLD :
* Pass the data directly to LBLD object locally .
* Pass the URL of JSON data and a custom JSON parser function .
##### 1.) Passing Coordinates directly into the LBLD API :
First, you need to make some blurred locations. Let's create 3 of them :
```js
locations = [[23.1 , 77.1],
[20.1 , 76.1],
[21.111 , 76.111];
```
Now you can pass them to the `options_display` object as following :
```js
var options_display = {
blurredLocation: BlurredLocation, // compulsory to pass
locations: locations
}
```
##### 2.) Using external API to fetch data :
Pass the URL in the `source_url` field and a JSON parser function for your API (you can take a look at the default JSON parser below to make your own !) .
```js
var options_display = {
blurredLocation: BlurredLocation, // compulsory to pass
source_url: "https://publiclab.org/api/srch/nearbyPeople", // external API
JSONparser: function jsonParser(result) { } // function to parse the above API
}
```
* JSONparser for external API:
1. Make an array of object.
2. Each object should have same parameters - `id`, `url`, `latitude`, `longitude`, `title`.
3. All the above parameters are used to make pop-up of each marker.
4. The below is also the default JSONparser which will be used automatically if you do not provide your own .
```js
function JSONparser(data) {
parsed_data = [];
if (!!data.items) {
for (i = 0 ; i < data.items.length; i++) {
let obj = {};
obj["id"] = data.items[i].doc_id;
obj["url"] = data.items[i].doc_url;
obj["latitude"] = parseFloat(data.items[i].latitude);
obj["longitude"] = parseFloat(data.items[i].longitude);
obj["title"] = data.items[i].doc_title;
parsed_data[parsed_data.length] = obj;
}
}
return parsed_data;
}
```
* popupDisplay for external API:
1. Make a string containing the HTML elements you want displayed for each marker popup.
2. Can use all the parameters from JSONparser by referencing the object.
4. The below is also the default popupDisplay which will be used automatically if you do not provide your own.
```js
function popupDisplay(obj) {
var popup_content = "";
popup_content += "
@" + obj.title + "
";
return popup_content
}
```
**[NOTE: We can use external API and also pass local data simultaneously !]
#### `zoom_filter` : Changing the zoom levels range where 'x' precision marker should be visible :
```js
// [lower zoom level , upper zoom level , >= precision allowed]
zoom_filter = [[0,4,0] , [5,7,2] , [8,11,4] , [12,18,5]];
```
The first number signifies the lower zoom level.
The second number signifies the upper zoom level.
The last number signifies that all markers having precision greater than equal to this number should be shown between lower zoom level and upper zoom level range.
The default zoom level filter array is:
```js
zoom_filter = [[0,4,0] , [5,7,2] , [8,11,4] , [12,18,5]] ;
```
#### Style parameter :
1.) style = `heatmap` shows only heatmap on map:

2.) style = `markers` shows only markers on map:

3.) style = `both` shows both heatmap and markers on map:
#### Markers color coding parameter :
We can switch on the markers color coding feature which colors the markers according to the precision of its coordinates using `color_code_markers` parameter which is by default `false`.
The following table is used for color coding :
| Precision | Color of marker |
|------------|-------------------|
| 0 | Blue |
| 1 | Red |
| 2 | Orange |
| 3 | Green |
| 4 | Black |
| 5 | Grey |
| >=6 | Yellow |
* When `color_code_markers` set to `true` :
* When `color_code_markers` set to `false` :

# Human-readable blurring :
Given `zoom_filter = [[0,4,0] , [5,7,2] , [8,11,4] , [12,18,5]] ;` ,
Our table to correlate zoom level, precision, and human-readable scale (from "country" to "building") is as follows:
Zoom level | Lat/lon coordinate precision | Human-readable placename
--|----|---
0 | `>= 0` | planet
3 | `>= 0` | country
4 | `>= 0` | country , state
5 | `>= 2` | country , state , province
6 | `>= 2` | country , state , province , region
11 | `>= 4` | neighbourhood
13 | `>= 5` | Exact Block
# API
| Methods | Use | Usage (Example)|
|-----------------|------------------------|----------------|
|`getVisibleLocations()` | returns array of markers of the input coordinates currently on map ! .| `blurredLocationDisplay.getVisibleLocations() //This would return the array of all the input coordinates currently visible on map`|
|`getMarkersOfPrecision({min: int , max: int})` |returns array - with source parameter indicating either `remote` or `local` marker with precision between `min` and `max` value {all markers are currently visible on map} . |`blurredLocationDisplay.getMarkersOfPrecision({min: 2 , max: 3}) //This would return 1 array - remote markers array and local markers array - having precision between 2 and 3`|
|`getMarkersOfPrecision(int)` | returns array - with source parameter indicating either `remote` or `local` marker {all markers are currently visible on map} |`blurredLocationDisplay.getMarkersOfPrecision(2) //This would return 1 array - remote markers array and local markers array - having precision = 2 `|
|`filterCoordinatesToPrecison(int)` | returns array of input coordinates with precision = (int) |`blurredLocationDisplay.filterCoordinatesToPrecison(2) //This would return array of coordinates with precision = 2 only `|
# Features
| Feature | Use |
|-----------------|------------------------------------------------------------|
| **'Blurred' location display** | Your exact location won't be posted, only the grid square it falls within will be shown till the level of precision you have set to your location.|
| **'Blurred' human-readable location display** | The name of the location you added will be displayed till the level of precision you set as the extent of address depends on the precision level you currently are on. For instance for precision 0 only the country name will be provided as you zoom in precision will increase and so will the address details, such as state, city, etc. |
#### 1.) Lower the precision , Greater the privacy :
The red markers corresponds to coordinates \[23.1 , 77.1\] , \[20.1 , 76.1\] having precision of 1 . At lower zoom level 5\*\*\*\* , these red markers are visible on map . 
But as you zoom in to level 6 , these red markers are removed from the map whereas other high precision markers are still visible .

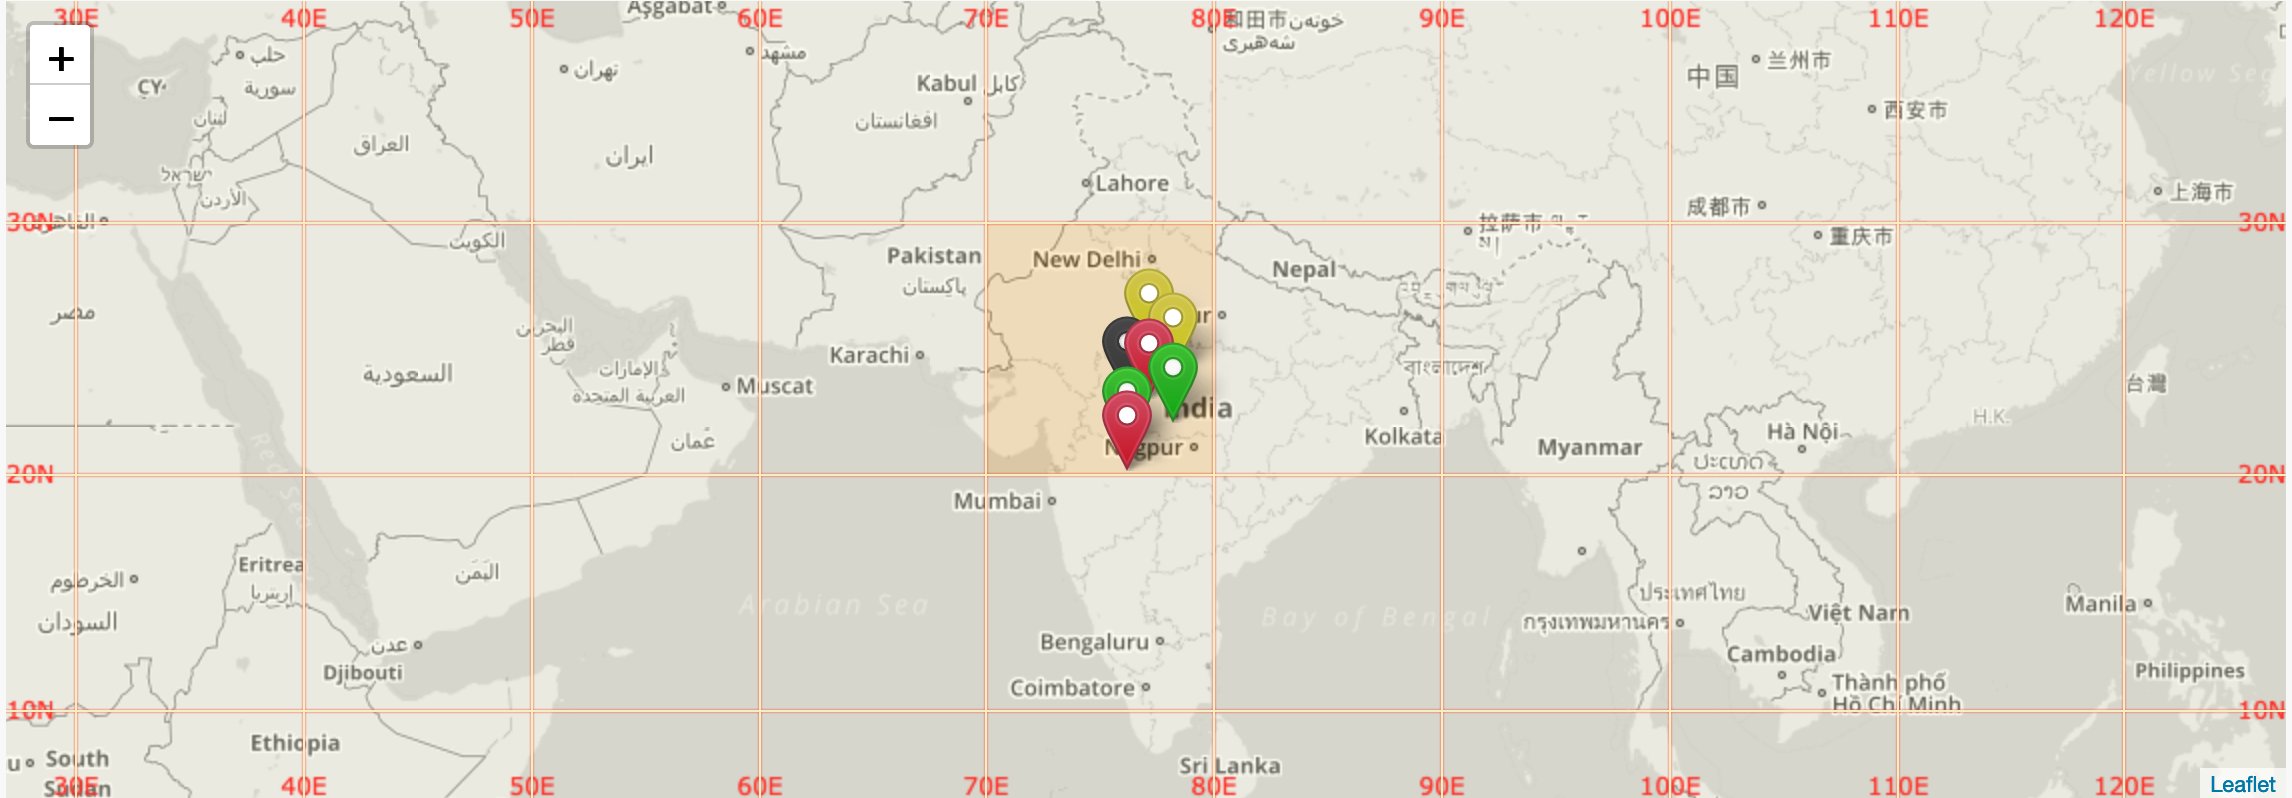
#### 2.) Color Coding of the markers :
According to the precision of the coordinates , different colors are given to the markers .
Precision = 0 , Blue colored markers .
Precision = 1 , Red colored markers .
Precision = 2 , Orange colored markers .
Precision = 3 , Green colored markers .
Precision = 4 , Black colored markers .
Precision = 5 , Grey colored markers .
Precision \>= 6 , Yellow colored markers .
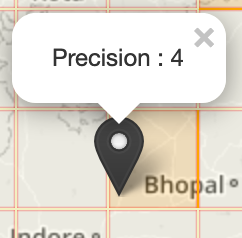
Also clicking the markers shows a pop-up telling the precision :
---------
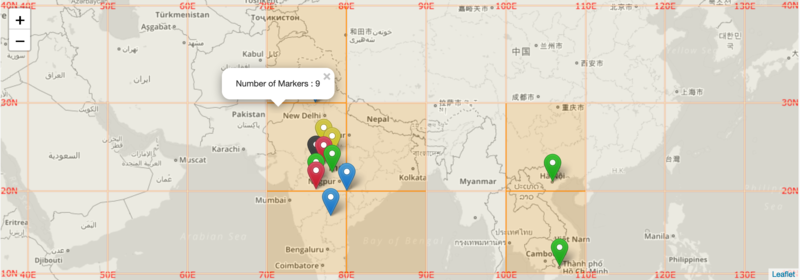
#### 3.) Heat map :
**Greater the markers in a region , Darker the color .**
We wanted to give an easy visualization power , so we implemented this grid heat map .

The default color of grid is : #F3F0C0
If number of markers are in range [1,10] , the color is : `#FFA500`
If number of markers are in range [11,15] , the color is : `#faff05`
If number of markers are in range [16,25] , the color is : `#FF6347`
If number of markers are in range [26,35] , the color is : `#FF4500`
If number of markers are in range [36,45] , the color is : `#FF0000`
If number of markers are greater than 45 , the color is : `#8B0000`
NOTE : Clicking on each rectangle shows the pop-up showing number of markers in that rectangle .
## Testing
Automated tests are an essential way to ensure that new changes don't break existing functionality, and can help you be confident that your code is ready to be merged in. We use Jasmine for testing: https://jasmine.github.io/2.4/introduction.html
To run tests, open /test.html in a browser. If you have phantomjs installed, you can run `grunt jasmine` to run tests on the commandline.
You can find the installation instructions for phantomjs in its official [build documentation](http://phantomjs.org/build.html). For Ubuntu/debian based system you can follow [these instructions](https://gist.github.com/julionc/7476620) or use the script mentioned there.
To add new tests, edit the `*_spec.js` files in `/spec/javascripts/`.
## Developers
Help improve Public Lab software!
* Look for open issues at https://github.com/publiclab/leaflet-blurred-location-display/issues
* We're specifically asking for help with issues labelled with [help-wanted](https://github.com/publiclab/leaflet-blurred-location-display/labels/help-wanted) tag
* Find lots of info on contributing at http://publiclab.org/wiki/developers
* Review specific contributor guidelines at http://publiclab.org/wiki/contributing-to-public-lab-software
* Some devs hang out in http://publiclab.org/chat (irc webchat)
* Join our gitter chat at https://gitter.im/publiclab/publiclab
## First Time?
New to open source/free software? Here is a selection of issues we've made especially for first-timers. We're here to help, so just ask if one looks interesting : https://github.com/publiclab/eaflet-blurred-location-display/labels/first-timers-only