https://github.com/pythoncoderunicorn/data-visual-gallery
A gallery collection of data visualizations in R
https://github.com/pythoncoderunicorn/data-visual-gallery
Last synced: 12 months ago
JSON representation
A gallery collection of data visualizations in R
- Host: GitHub
- URL: https://github.com/pythoncoderunicorn/data-visual-gallery
- Owner: PythonCoderUnicorn
- Created: 2021-11-27T19:39:04.000Z (over 4 years ago)
- Default Branch: main
- Last Pushed: 2021-11-28T18:19:13.000Z (over 4 years ago)
- Last Synced: 2025-03-11T05:18:40.146Z (over 1 year ago)
- Language: R
- Size: 60.5 KB
- Stars: 0
- Watchers: 1
- Forks: 0
- Open Issues: 0
-
Metadata Files:
- Readme: README.md
Awesome Lists containing this project
README
# Data Visual Gallery
A gallery collection of data visualizations in R
## Stacked Bar chart

## Stacked Proportional Bar chart

## Boxplot with jitter

## 2D Histogram

## 2D Histogram with bins

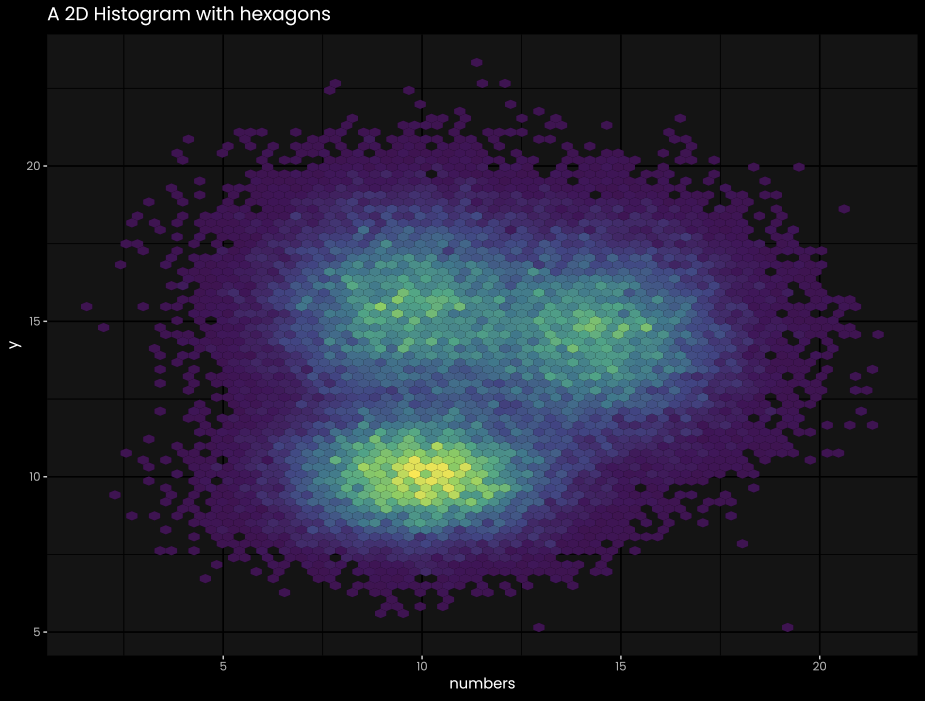
## 2D Histogram with hexagons
## stat density using raster

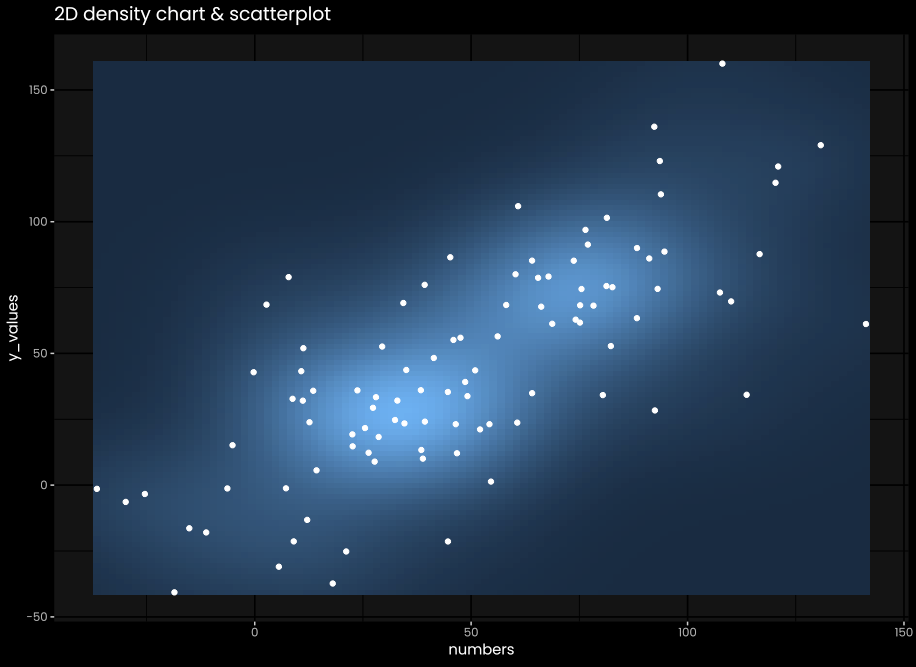
## 2D density & scatterplot
## Gapminder bubble plot

## basic density chart

## mirror density plot

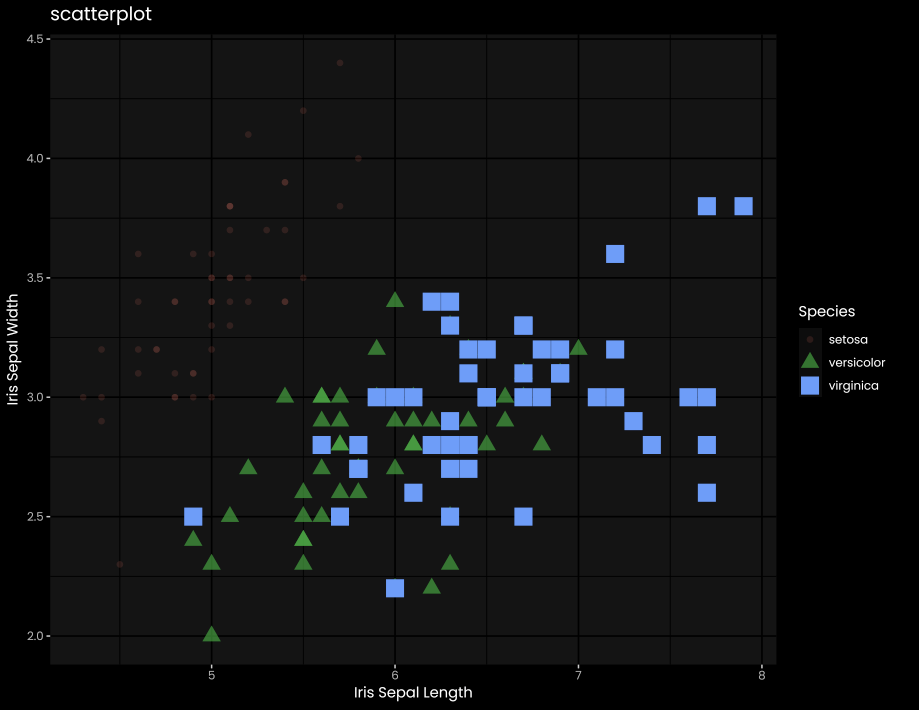
## scatterplot

### scatterplot with shapes
## Parallel coordinate plot

### Standardize iris data in Parallel coordinate plot

## Heatmaps
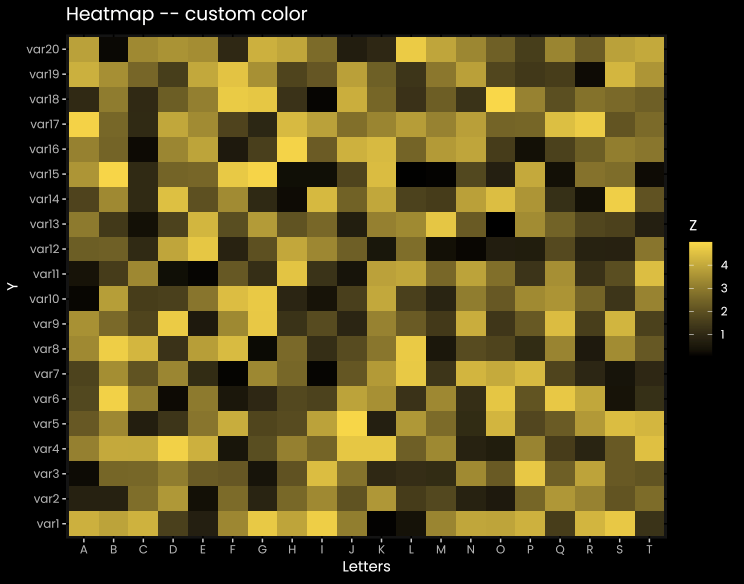
### scale_fill_distiller

### scale_fill_viridis

## connected scatterplot

## Polynomial Curve scatterplot

## Lollipop plot

### Lollipop plot with categories

### Lollipop plot with baseline

## Time Series lineplot

### Time Series line & point plot

## Treemap
