https://github.com/qhdwight/wsc-wolvfield
WSC 2022 WolvFIeld Challenge Explanation & Source Code
https://github.com/qhdwight/wsc-wolvfield
ctf ctf-writeups cybersecurity
Last synced: 3 months ago
JSON representation
WSC 2022 WolvFIeld Challenge Explanation & Source Code
- Host: GitHub
- URL: https://github.com/qhdwight/wsc-wolvfield
- Owner: qhdwight
- Created: 2022-03-28T03:19:23.000Z (over 4 years ago)
- Default Branch: master
- Last Pushed: 2022-03-28T17:50:21.000Z (over 4 years ago)
- Last Synced: 2025-10-06T14:51:44.309Z (10 months ago)
- Topics: ctf, ctf-writeups, cybersecurity
- Language: C#
- Homepage: https://ctfd.wolvsec.org/
- Size: 161 KB
- Stars: 1
- Watchers: 1
- Forks: 0
- Open Issues: 0
-
Metadata Files:
- Readme: README.md
Awesome Lists containing this project
README
# WolvField
reverse medium/hard, 4 solves, 500 points
### Motivation
I wrote this challenge since I found that GPU code hasn't appeared too much in the average CTF. That combined with my love for video game design I figured this would be a pretty cool challenge!
### First Looks
Right off the bat we need to recognize that this is a .NET executable. We can figure that out pretty easily with the `strings` tool on `WolvField.exe`:
```
[quintin@vmware-arch Shared]$ strings WolvField.exe | grep NET
DOTNET_IPC_V1
DOTNET_IPC_V1
.NET Server GC
.NET BGC
FMicrosoft-Windows-DotNETRuntime
Microsoft-DotNETCore-EventPipeConfiguration
Microsoft-DotNETCore-EventPipe
Microsoft-DotNETCore-SampleProfiler
Microsoft-Windows-DotNETRuntimeRundown
Microsoft-Windows-DotNETRuntimePrivate
DOTNET_IPC_V1
Silk.NET.Vulkan.Extensions.EXT
Silk.NET.Core
Silk.NET.Core.Native
Silk.NET.Vulkan
```
This part is so crucial to getting started that I added it as a hint. After all it is a ~64M file and I know that appears scary at first glance.
### Decompilation
A great open source tool for .NET decompilation is [IL-Spy](https://github.com/icsharpcode/ILSpy). That being said I chose to use JetBrains dotPeek, but both should work. Let's open up the binary:
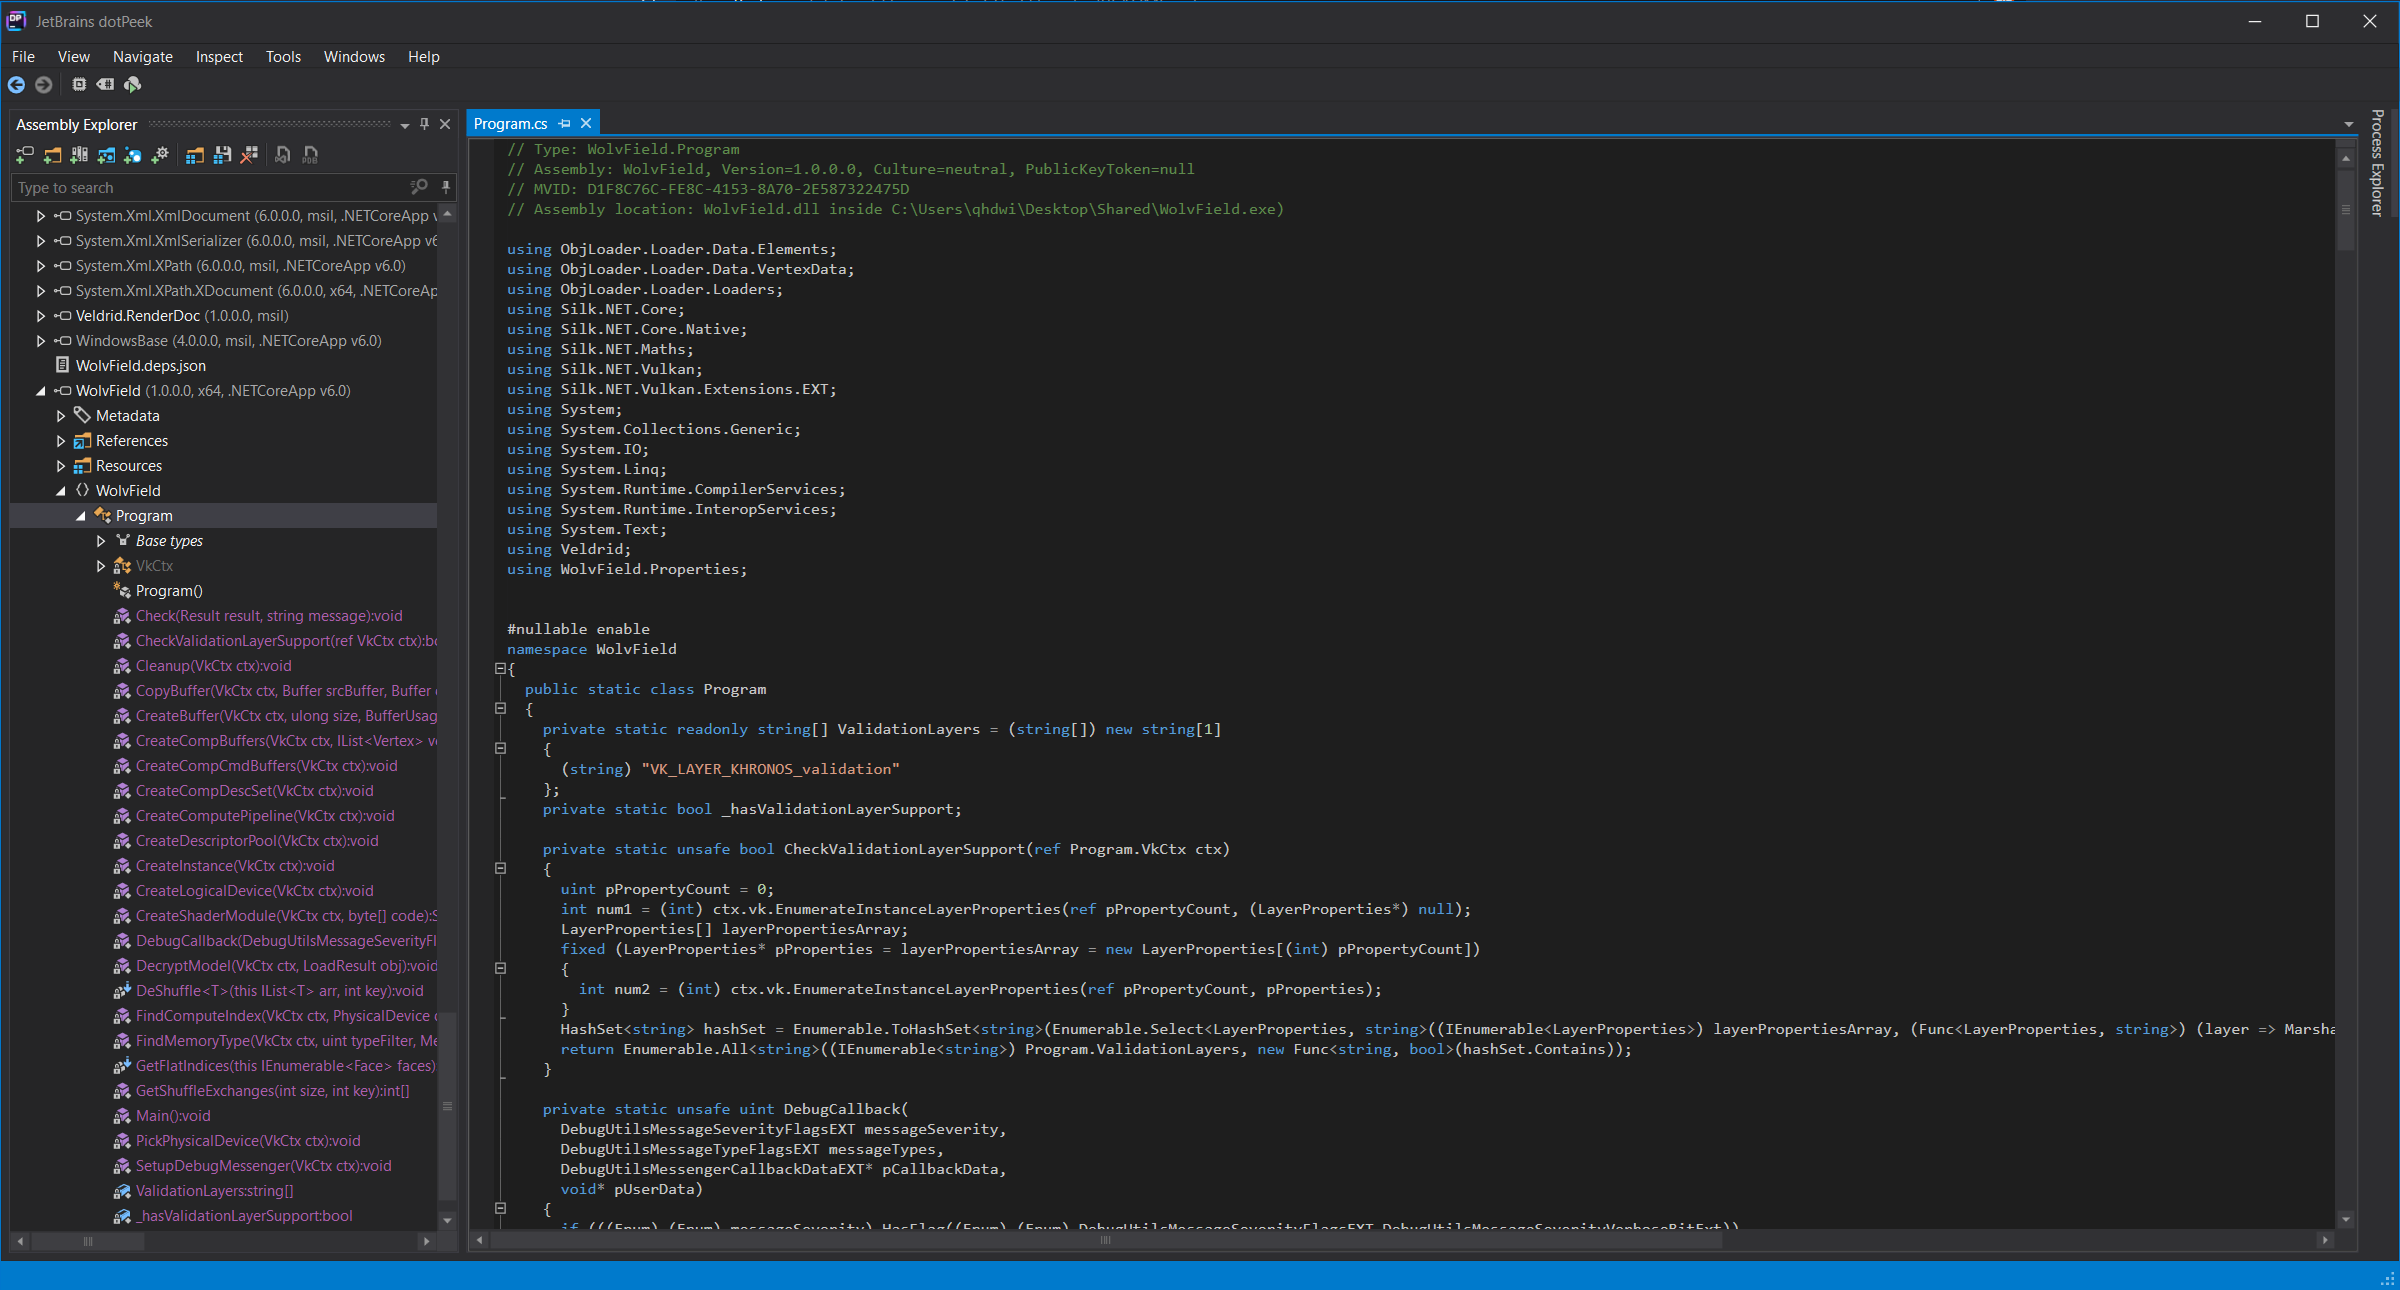
Scrolling past all of the `System*` namespaces we can find the `WolvField` one pretty easily. Inside we find a class called `Program`. There seems to be a lot of functions setting up Vulkan via the SILK.NET API. Going even further, we find the functions `Main`, `DecryptModel`, and `DeShuffle` which seem pretty interesting to us based off of the challenge description "It seems they left some secret assets hidden in the executable..." Generally speaking when I reverse CTF challenges I make sure to ask myself, "How important really is this function in the overall picture?" And in this case, reversing most of the functions inside of `Program` would be useless. So let's check out the critical ones:
```csharp
private static int[] GetShuffleExchanges(int size, int key)
{
int[] shuffleExchanges = (int[]) new int[size - 1];
Random random = new Random(key);
for (int index = size - 1; index > 0; --index)
{
int num = random.Next(index + 1);
shuffleExchanges[size - 1 - index] = num;
}
return shuffleExchanges;
}
private static void DeShuffle(this IList arr, int key)
{
int count = ((ICollection) arr).Count;
int[] shuffleExchanges = Program.GetShuffleExchanges(count, key);
for (int index = 1; index < count; ++index)
{
int num1 = shuffleExchanges[count - index - 1];
IList objList1 = arr;
int num2 = index;
IList objList2 = arr;
int num3 = num1;
T obj1 = arr[num1];
T obj2 = arr[index];
int num4 = num2;
T obj3;
T obj4 = obj3 = obj1;
objList1[num4] = obj3;
objList2[num3] = obj4 = obj2;
}
}
private static List GetFlatIndices(this IEnumerable faces) => Enumerable.ToList(Enumerable.SelectMany(faces, (Func>) (face =>
{
int count = face.Count;
uint[] flatIndices = (uint[]) new uint[count];
for (int i = 0; i < count; ++i)
flatIndices[i] = (uint) face[i].VertexIndex;
return (IEnumerable) flatIndices;
})));
```
We can see that `DeShuffle` is called on the flattened indices of a `.obj` model loaded from a resource file:
`Main()`:
```csharp
LoadResult loadResult = new ObjLoaderFactory().Create().Load((Stream) new MemoryStream(Resources.Model));
...
Program.DecryptModel(ctx, loadResult);
```
`DecryptModel(Program.VkCtx ctx, LoadResult obj)`:
```
((IList) ((IEnumerable) Enumerable.First((IEnumerable) obj.Groups).Faces).GetFlatIndices()).DeShuffle(1337);
```
### Indices on the CPU
It is pretty simple at this point to extract the model resource and then use a Python script to apply the deshuffle and dump all the indices into a `OutputIndices.txt`. I omitted this part but it should be straight forward. The `.obj` file format is actually extremely readable, here is a peek:
```
o Model
v 38.517850 0.000000 -0.449000
v 38.428850 0.000000 -0.449000
v -30.408870 0.000000 0.000000
v -30.319870 0.000000 0.000000
...
f 1518 366 1455
f 230 885 453
f 1181 1461 1214
f 944 1052 942
f 492 1252 1075
...
```
We can notice now why we needed to flatten the indices, they are marked by the `f` prefix and are grouped three at a time. Of course, things seem easy now right? That is the luxury of having this code on the CPU. Let's check out the twist part of this challenge.
### Vertices on the GPU
A crucial part is to recognize this pattern in `Main`:
```csharp
...
renderDoc?.StartFrameCapture();
... a bunch of Vulkan setup ...
renderDoc?.EndFrameCapture();
...
```
And in `DecryptModel(Program.VkCtx ctx, LoadResult obj)`:
```csharp
Vk vk = ctx.vk;
fixed (CommandBuffer* commandBufferPtr = &ctx.compCmdBuf)
fixed (DescriptorSet* pDescriptorSets = &ctx.compDescSet)
{
CommandBufferBeginInfo pBeginInfo = new CommandBufferBeginInfo(new StructureType?(StructureType.CommandBufferBeginInfo), (void*) null, new CommandBufferUsageFlags?(), (CommandBufferInheritanceInfo*) null);
int num1 = (int) vk.BeginCommandBuffer(ctx.compCmdBuf, in pBeginInfo);
vk.CmdBindPipeline(ctx.compCmdBuf, PipelineBindPoint.Compute, ctx.compPipeline);
vk.CmdBindDescriptorSets(ctx.compCmdBuf, PipelineBindPoint.Compute, ctx.compPipelineLayout, 0U, 1U, pDescriptorSets, 0U, (uint*) null);
vk.CmdDispatch(ctx.compCmdBuf, (uint) ((ICollection) obj.Vertices).Count / 32U + 1U, 1U, 1U);
int num2 = (int) vk.EndCommandBuffer(ctx.compCmdBuf);
SubmitInfo pSubmits = new SubmitInfo(new StructureType?(StructureType.SubmitInfo), (void*) null, new uint?(), (Semaphore*) null, (PipelineStageFlags*) null, new uint?(1U), commandBufferPtr, new uint?(), (Semaphore*) null);
int num3 = (int) vk.QueueSubmit(ctx.queue, 1U, in pSubmits, new Fence());
int num4 = (int) vk.QueueWaitIdle(ctx.queue);
}
```
At this point you should probably think, what is RenderDoc? And then figure out that it is a graphical debugger. It has the ability to attach to programs and view all of the various GPU resources that are used. In this case we are dispatching a command buffer (`vk.BeginCommandBuffer`, `vk.QueueSubmit(ctx.queue, 1U, in pSubmits, new Fence())`). However, it appears we are never reading back that memory from the GPU. What is important about that memory you may ask? It is important to notice that in `CreateCompBuffer` we pass our model vertices as a parameter:
```csharp
private static unsafe void CreateCompBuffers(Program.VkCtx ctx, IList vertices)
{
ulong size1 = (ulong) (Unsafe.SizeOf>() * 1588);
Program.CreateBuffer(ctx, size1, BufferUsageFlags.BufferUsageTransferDstBit | BufferUsageFlags.BufferUsageStorageBufferBit, MemoryPropertyFlags.MemoryPropertyDeviceLocalBit | MemoryPropertyFlags.MemoryPropertyHostVisibleBit, ref ctx.compBufOut, ref ctx.compBufMemOut);
ulong size2 = (ulong) (Unsafe.SizeOf>() * 1588);
Silk.NET.Vulkan.Buffer buffer = new Silk.NET.Vulkan.Buffer();
DeviceMemory bufferMemory = new DeviceMemory();
Program.CreateBuffer(ctx, size2, BufferUsageFlags.BufferUsageTransferSrcBit, MemoryPropertyFlags.MemoryPropertyHostVisibleBit | MemoryPropertyFlags.MemoryPropertyHostCoherentBit, ref buffer, ref bufferMemory);
void* voidPtr;
int num = (int) ctx.vk.MapMemory(ctx.device, bufferMemory, 0UL, size2, 0U, &voidPtr);
Vector4D[] vector4DArray = new Vector4D[((ICollection) vertices).Count];
for (int index = 0; index < 1588; ++index)
{
Vertex vertex = vertices[index];
vector4DArray[index] = new Vector4D(vertex.X, vertex.Y, vertex.Z, 0.0f);
}
MemoryExtensions.AsSpan>(vector4DArray).CopyTo(new Span>(voidPtr, vector4DArray.Length));
ctx.vk.UnmapMemory(ctx.device, bufferMemory);
Program.CreateBuffer(ctx, size2, BufferUsageFlags.BufferUsageTransferDstBit | BufferUsageFlags.BufferUsageStorageBufferBit, MemoryPropertyFlags.MemoryPropertyDeviceLocalBit, ref ctx.compBufIn, ref ctx.compBufMemIn);
Program.CopyBuffer(ctx, buffer, ctx.compBufIn, size2);
ctx.vk.DestroyBuffer(ctx.device, buffer, (AllocationCallbacks*) null);
ctx.vk.FreeMemory(ctx.device, bufferMemory, (AllocationCallbacks*) null);
}
```
So at this point you should think, hmm, we are decrypting the indices, and the vertices are being sent to the GPU, presumably some operations are unscrambling them, BUT unfortunately they are not being copied back. So it may help you to learn that RenderDoc can actually capture this entire transaction, including what the final buffer on the GPU will be. So fire RenderDoc up and check out the "Launch Application" tab:
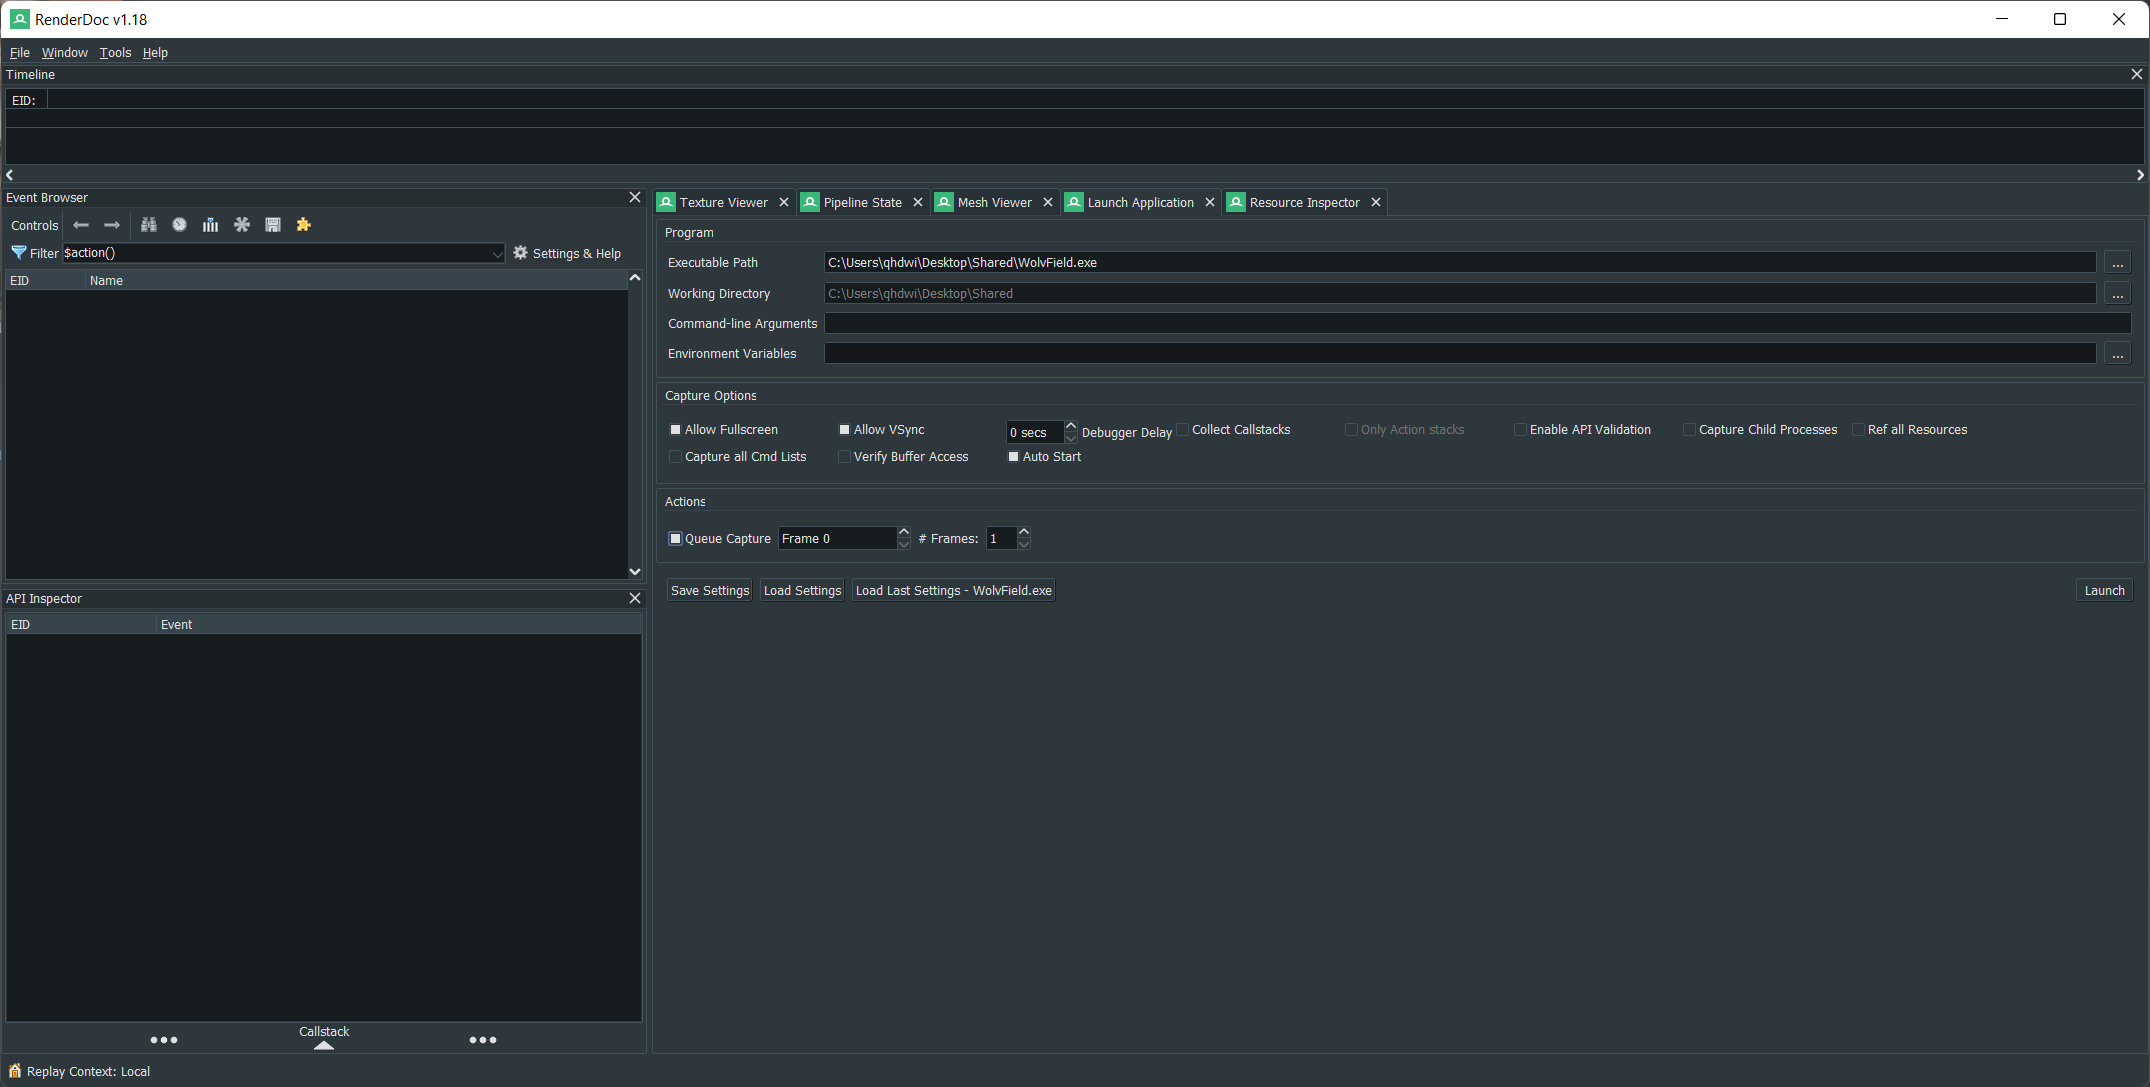
Notice that "Auto Start" and "Queue Capture" are set. This means we try to capture a frame right away, the one denoted by the `StartFrameCapture` and `EndFrameCapture` calls we reversed earlier.
Hitting "Launch" we get a capture:
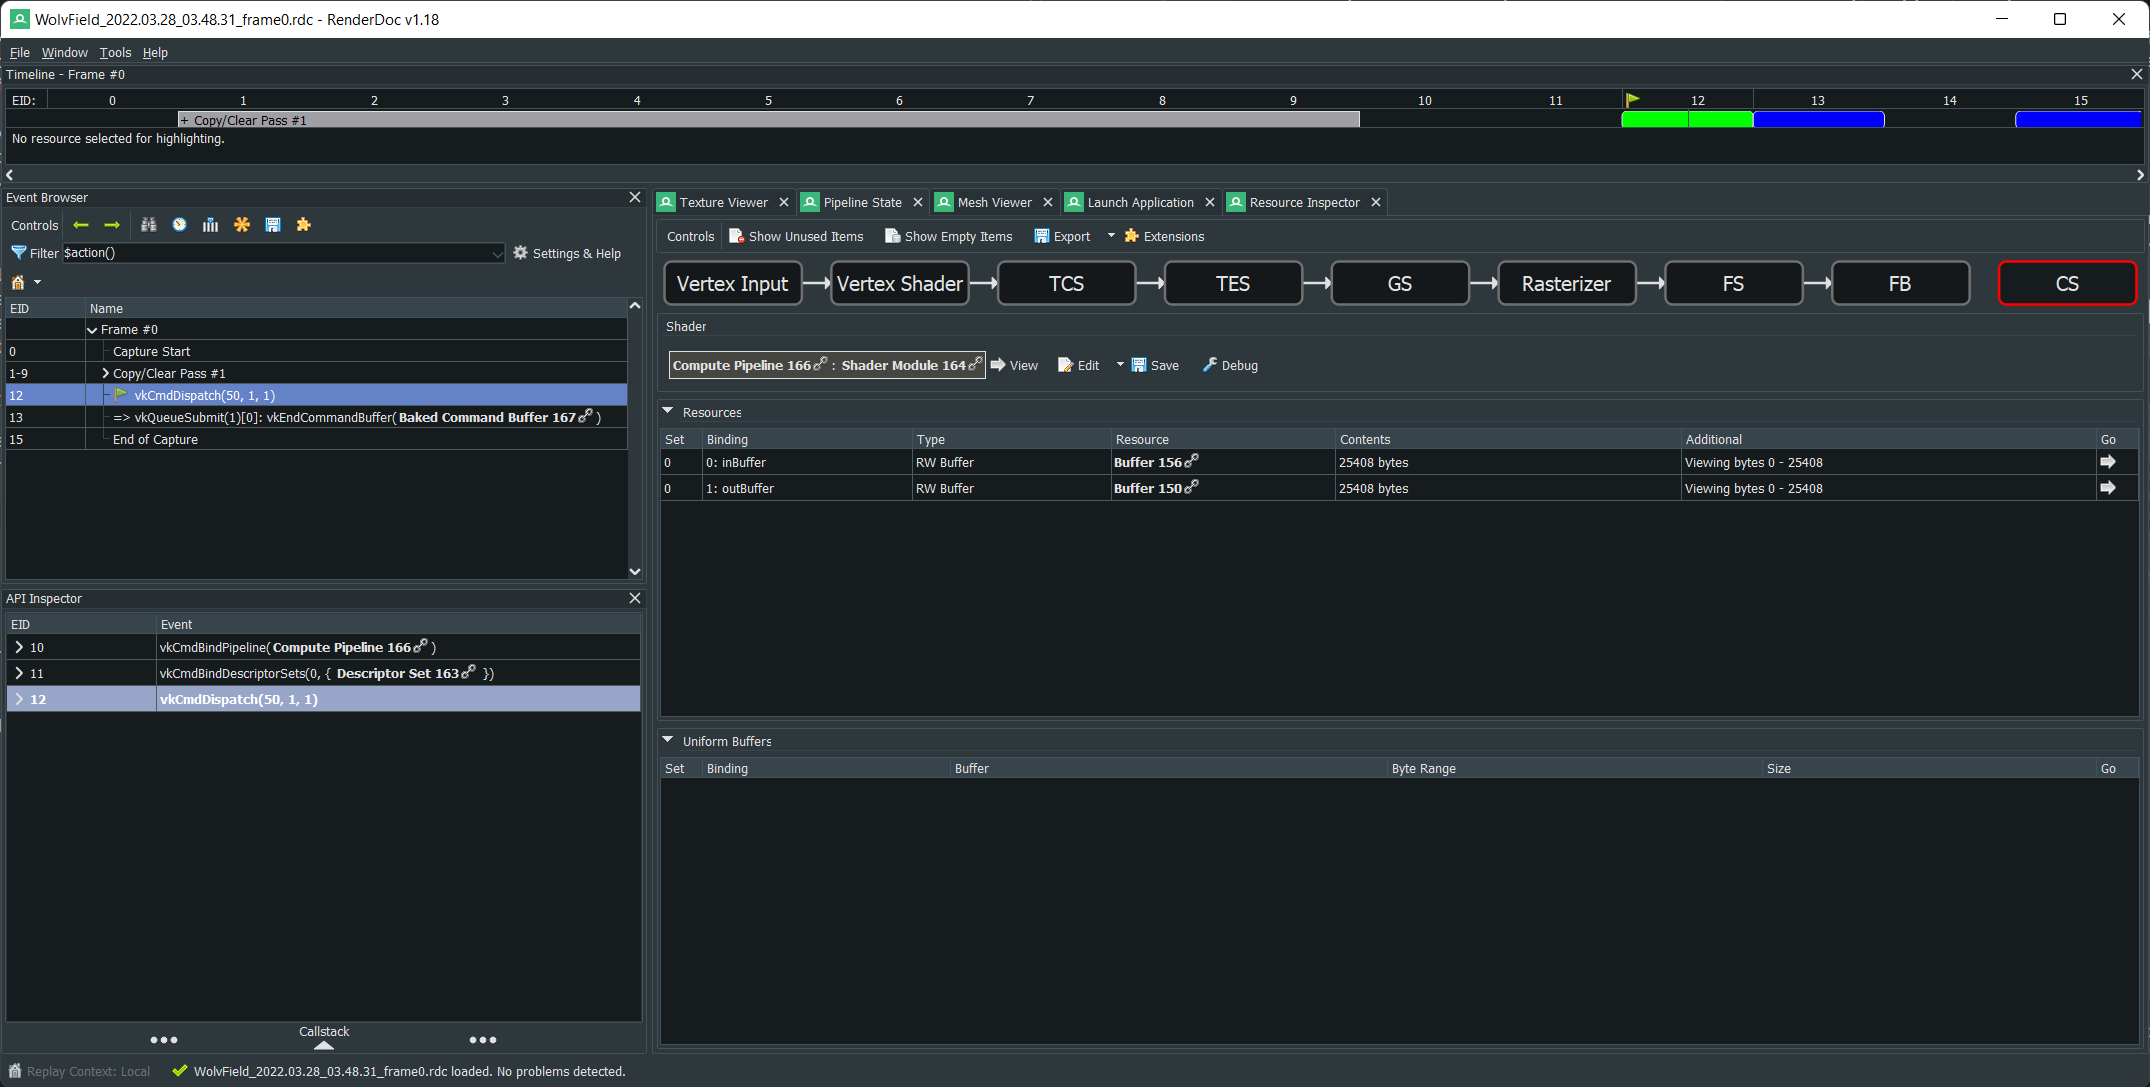
Selecting the `vkCmdDispatch` event on the left hand, and selecting the `Pipeline State`->`CS` tab we can see the two buffers that went to the compute shader, the input and output. Double clicking on the output buffer leads us to a handy viewer. We can then right click there and export it as CSV:
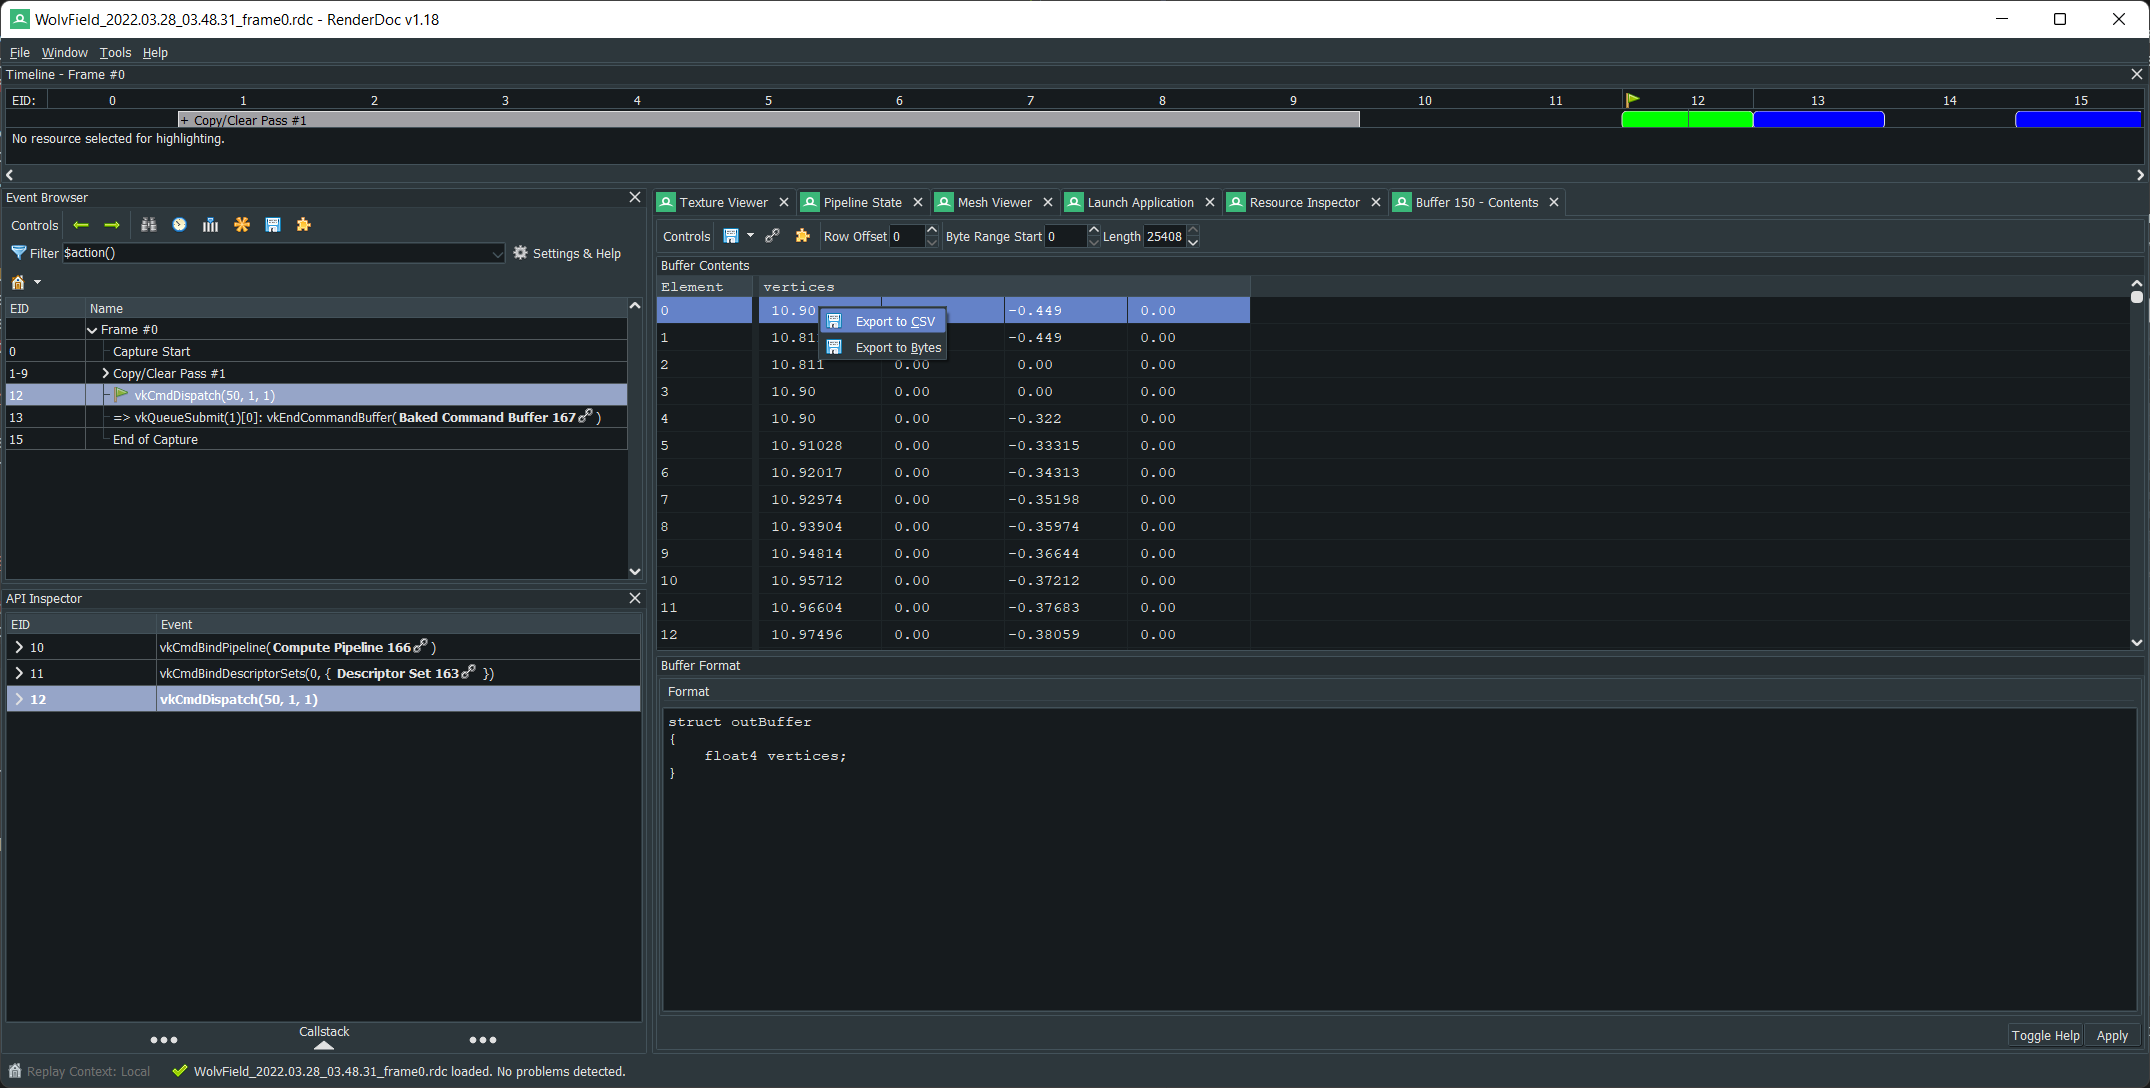
Now I will make the script that puts these dumped vertices and indices together and creates a `.obj` file we can easily open in Blender.
```python
from itertools import zip_longest
import csv
def chunk(arr, n):
return (arr[pos:pos + n] for pos in range(0, len(arr), n))
with open("Output.obj", "w") as obj_file, open("OutputVertices.csv", "r") as vert_file, open("OutputIndices.txt", "r") as idx_file:
vert_data = csv.reader(vert_file)
next(vert_data)
obj_file.write("o Flag\n")
for vert in vert_data:
x, y, z, _ = map(float, vert[1:])
obj_file.write(f"v {x:.6f} {y:.6f} {z:.6f}\n")
for face in chunk(list(map(int, idx_file.readlines())), 3):
obj_file.write(f"f {face[0]} {face[1]} {face[2]}\n")
```
Continuing on to Blender:
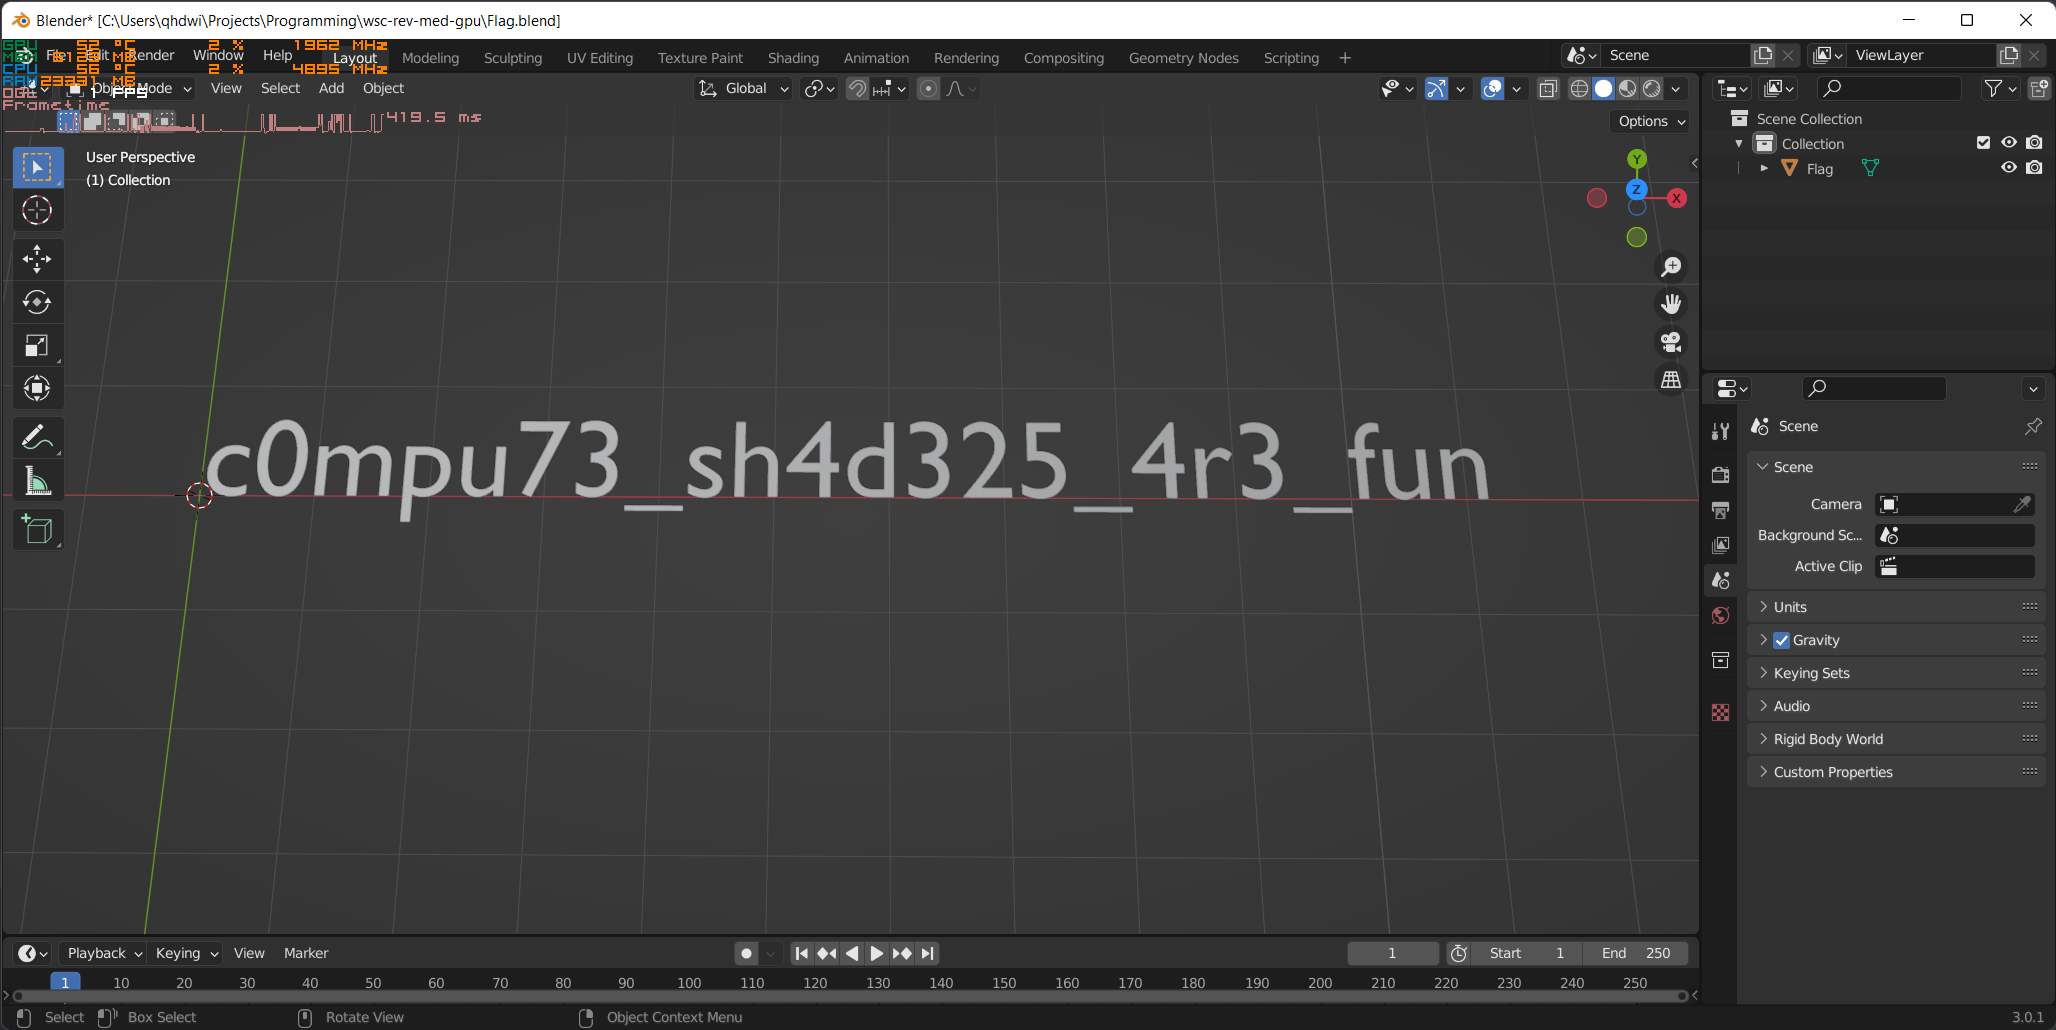
There we go! We got the flag!
### Notes
I really wanted to make a Linux executable for this challenge. But it turns out capturing headless computes on the Linux build of RenderDoc is currently broken. So I didn't really want to throw people off track with that. Theoretically you could have just extracted the shader and done everything yourself (I know at least one team did that), which works too. I know some people also used the `spirv-cross` tools to disassemble the `SPIR-V` shader into `GLSL` then write a CPU program that emulated the behavior. Pretty smart.
This was my first major CTF challenge! Let me know how you enjoyed it, feedback is always appreciated :)