https://github.com/rapidsai/jupyterlab-nvdashboard
A JupyterLab extension for displaying dashboards of GPU usage.
https://github.com/rapidsai/jupyterlab-nvdashboard
Last synced: 7 months ago
JSON representation
A JupyterLab extension for displaying dashboards of GPU usage.
- Host: GitHub
- URL: https://github.com/rapidsai/jupyterlab-nvdashboard
- Owner: rapidsai
- License: bsd-3-clause
- Created: 2019-08-12T15:22:10.000Z (over 6 years ago)
- Default Branch: branch-0.14
- Last Pushed: 2025-04-03T23:18:08.000Z (8 months ago)
- Last Synced: 2025-04-04T17:01:36.376Z (8 months ago)
- Language: TypeScript
- Size: 14 MB
- Stars: 638
- Watchers: 17
- Forks: 79
- Open Issues: 46
-
Metadata Files:
- Readme: README.md
- Contributing: CONTRIBUTING.md
- License: LICENSE
Awesome Lists containing this project
- awesome-jupyter-resources - GitHub - 42% open · ⏱️ 23.06.2022): (JupyterLab扩展)
- best-of-jupyter - GitHub - 45% open · ⏱️ 10.09.2025): (JupyterLab Extensions)
- awesome-robotic-tooling - jupyterlab-nvdashboard - A JupyterLab extension for displaying dashboards of GPU usage. (Operation System / Monitoring)
README
# JupyterLab NVdashboard
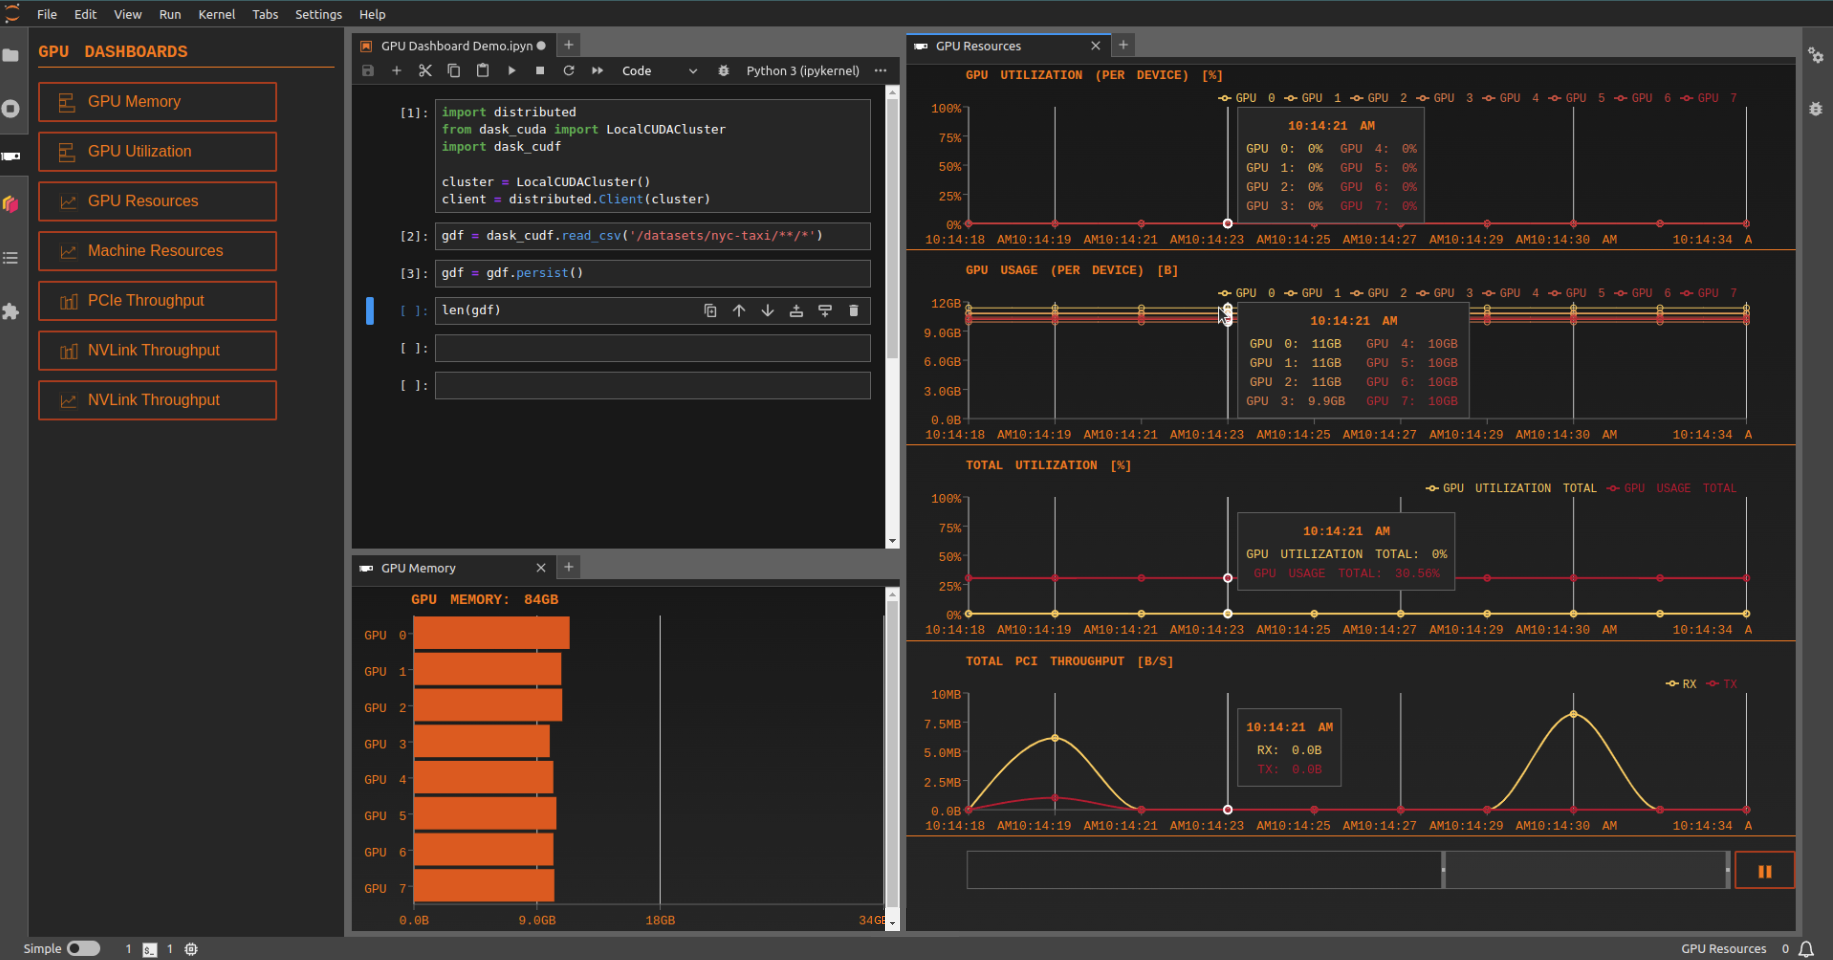
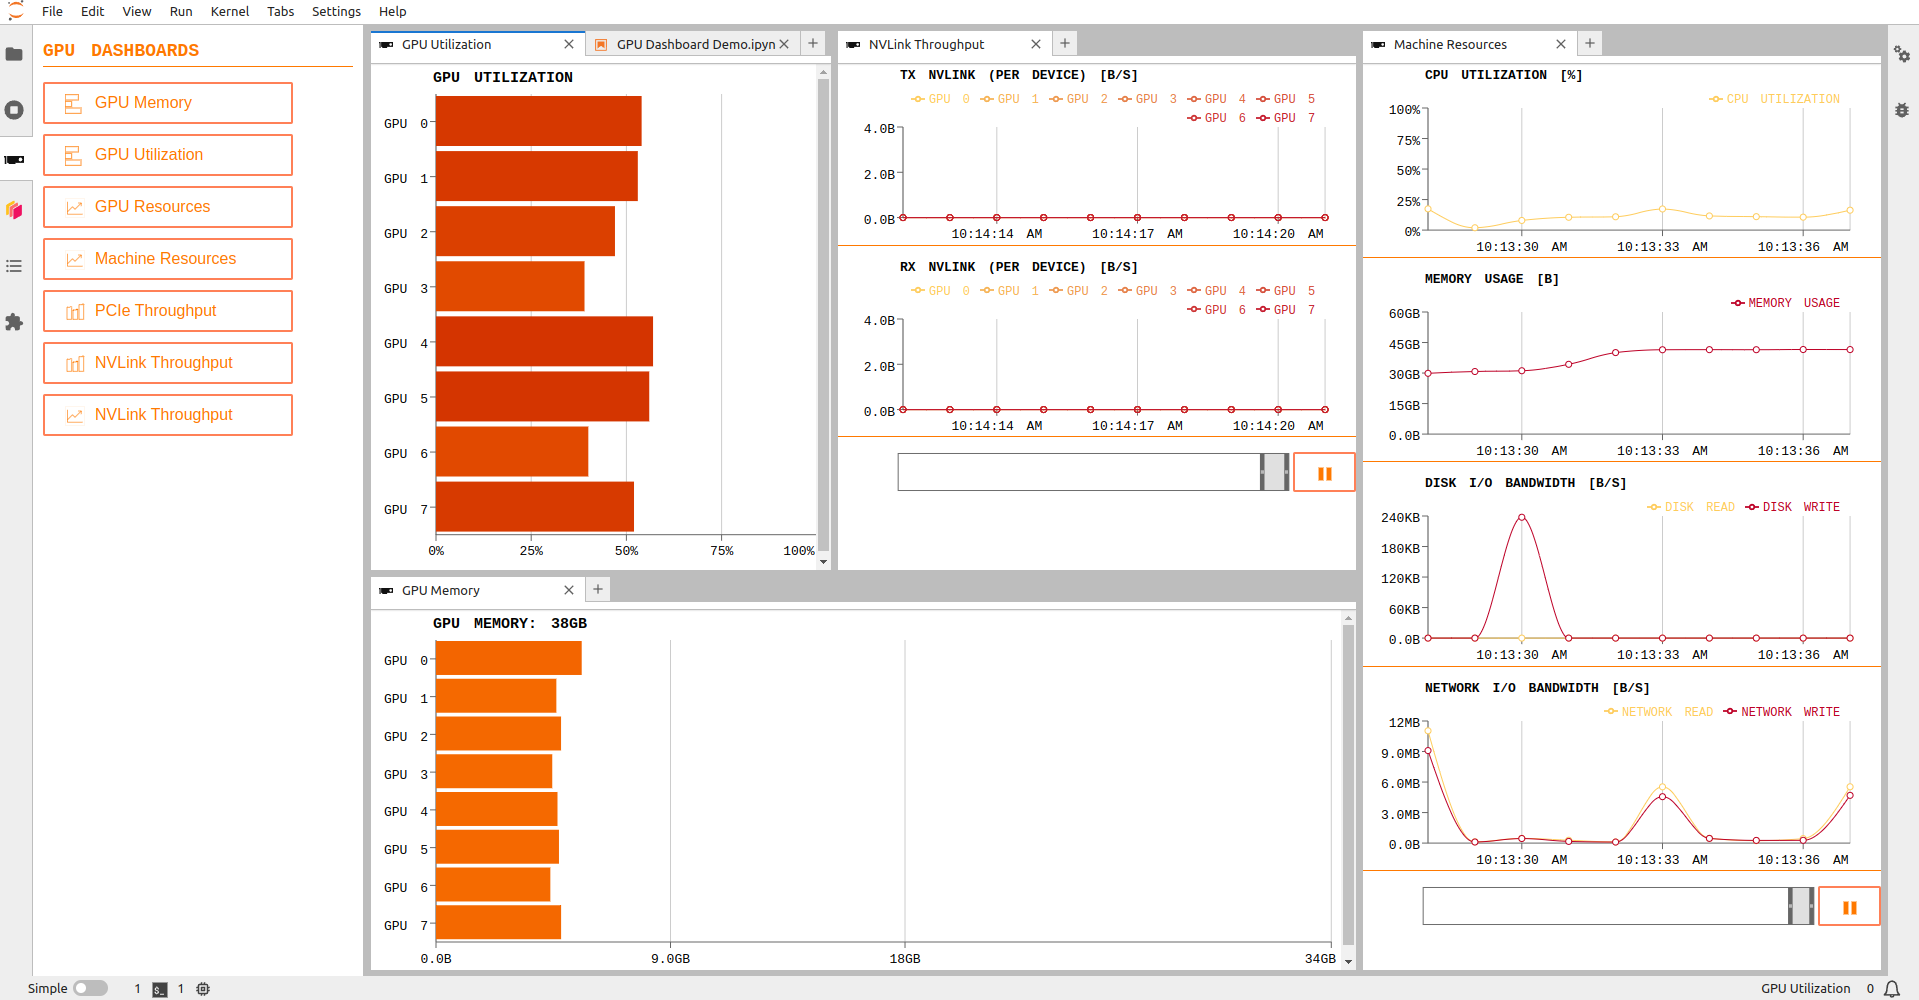
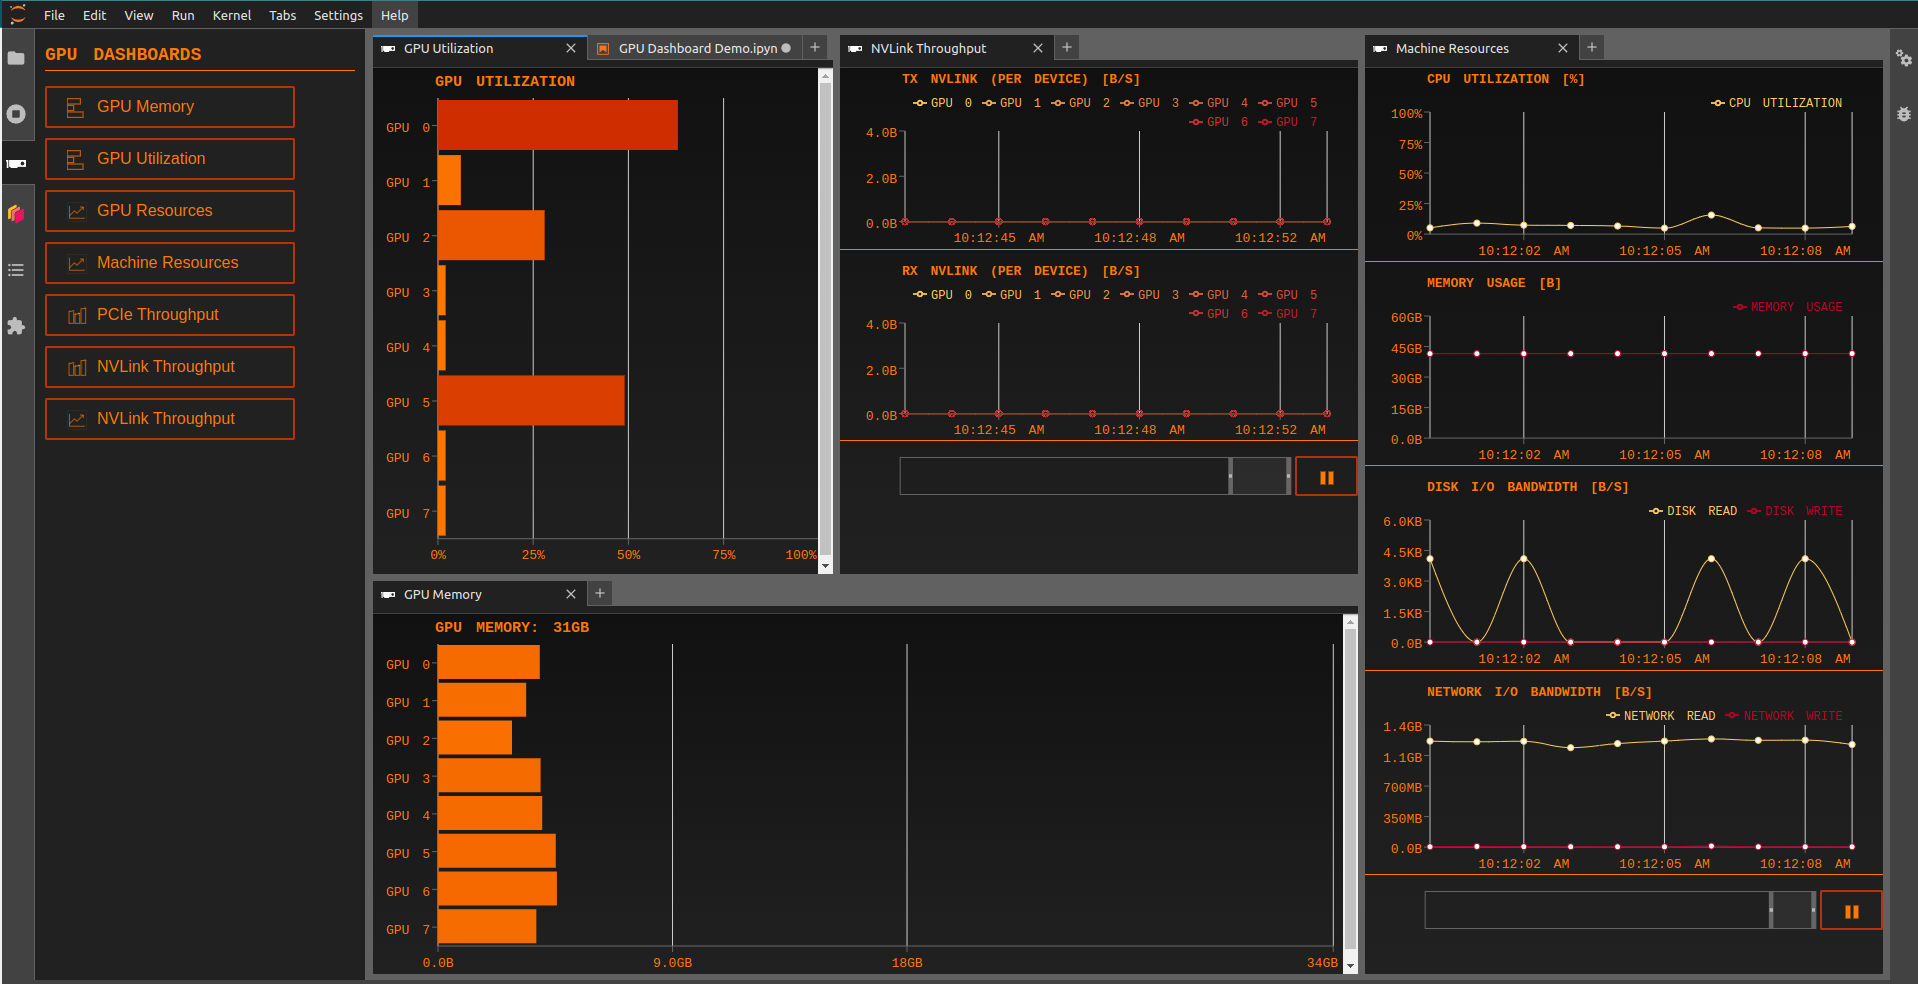
NVDashboard is a JupyterLab extension for displaying GPU usage dashboards. It enables JupyterLab users to visualize system hardware metrics within the same interactive environment they use for development. Supported metrics include:
- GPU-compute utilization
- GPU-memory consumption
- PCIe throughput
- NVLink throughput
## Demo
## Table of Contents
- [New Features](#new-features)
- [Brush for Time Series Charts](#brush-for-time-series-charts)
- [Synced Tooltips](#synced-tooltips)
- [Theme Compatibility](#theme-compatibility)
- [Version Compatibility](#version-compatibility)
- [Requirements](#requirements)
- [Installation](#installation)
- [Troubleshoot](#troubleshoot)
- [Contributing](#contributing-developers-guide)
- [Future Improvements](#future-improvements)
## New Features
JupyterLab-nvdashboard v4 brings a host of new features, improved backend architecture, and enhanced frontend components for an even better user experience.
Explore the exciting updates below.
### Brush for Time Series Charts
Introducing a powerful brushing feature for time series charts. Users can easily inspect past events by selecting a specific time range, providing more granular control over data exploration.
### Synced Tooltips
For pages with multiple charts, JupyterLab-nvdashboard now offers synchronized tooltips for timestamps across all charts. This feature enhances the user's ability to analyze data cohesively and understand relationships between different data points.
### Theme Compatibility
Seamless integration with JupyterLab themes is now a reality. The extension adapts its colors and aesthetics based on whether the user is in a light or dark theme, ensuring a consistent and visually appealing experience.
#### Light Theme
#### Dark Theme
## Version Compatibility
JupyterLab-nvdashboard v4 is designed exclusively for JupyterLab v4 and later versions. To ensure continued support for JupyterLab v3 users, we will maintain the previous version separately (branch-0.9).
## Requirements
- JupyterLab >=4
- pynvml
- psutil
## Installation
### Conda
```bash
# nightly version (for jupyterlab>=4)
conda install -c rapidsai-nightly -c conda-forge jupyterlab-nvdashboard
# stable version (for jupyterlab<4)
conda install -c rapidsai -c conda-forge jupyterlab-nvdashboard
```
### PyPI
```bash
# nightly version (for jupyterlab>=4)
pip install --extra-index-url https://pypi.anaconda.org/rapidsai-wheels-nightly/simple --pre jupyterlab_nvdashboard
# stable version (for jupyterlab<4)
pip install jupyterlab_nvdashboard
```
## Troubleshoot
If you are seeing the frontend extension, but it is not working, check
that the server extension is enabled:
```bash
jupyter server extension list
```
If the server extension is installed and enabled, but you are not seeing
the frontend extension, check the frontend extension is installed:
```bash
jupyter labextension list
```
## Contributing Developers Guide
For more details, check out the [contributing guide](./CONTRIBUTING.md).
## Future Improvements
While we've introduced a range of exciting features in this release, we understand that there are always opportunities for improvement. We have noted a request to add cell execution markers to the charts. Due to the complexities associated with asynchronous cells, we have decided to defer this feature to a future update. Rest assured, we will explore this enhancement in subsequent releases.