Ecosyste.ms: Awesome
An open API service indexing awesome lists of open source software.
https://github.com/ratreya/covid-19
Datasets for COVID-19 and visualization using Jupyter Notebook.
https://github.com/ratreya/covid-19
covid-19 jupyter-notebook
Last synced: 14 days ago
JSON representation
Datasets for COVID-19 and visualization using Jupyter Notebook.
- Host: GitHub
- URL: https://github.com/ratreya/covid-19
- Owner: ratreya
- License: mit
- Created: 2020-03-22T18:24:10.000Z (almost 5 years ago)
- Default Branch: master
- Last Pushed: 2020-12-25T21:16:44.000Z (about 4 years ago)
- Last Synced: 2024-12-12T12:45:02.761Z (2 months ago)
- Topics: covid-19, jupyter-notebook
- Language: HTML
- Homepage:
- Size: 34.9 MB
- Stars: 2
- Watchers: 3
- Forks: 0
- Open Issues: 0
-
Metadata Files:
- Readme: README.md
- License: LICENSE
Awesome Lists containing this project
README
# COVID-19 Notebooks
[](https://mybinder.org/v2/gh/ratreya/COVID-19/master?filepath=visualization.ipynb)
* `base-builder.ipynb` is run to produce the base build of merged and cleaned-up CSV file from [JHU CSSE daily reports](https://github.com/CSSEGISandData/COVID-19/tree/master/csse_covid_19_data/csse_covid_19_daily_reports). `jhu-daily-reports.csv` has the following columns:
| Country | State | County | Date | Confirmed | Deaths | Recovered | Confirmed_New | Deaths_New | Recovered_New |
|---------|-------|--------|---------|-----------|--------|-----------|---------------|------------|---------------|
| | | | | | | | | | |
* `incremental-builder.ipynb` is run everyday to incrementally merge in new data into `jhu-daily-reports.csv`.
* `visualization.ipynb` reads this CSV and generates the following visualizations.
## First Wave and Second Wave for U.S.
[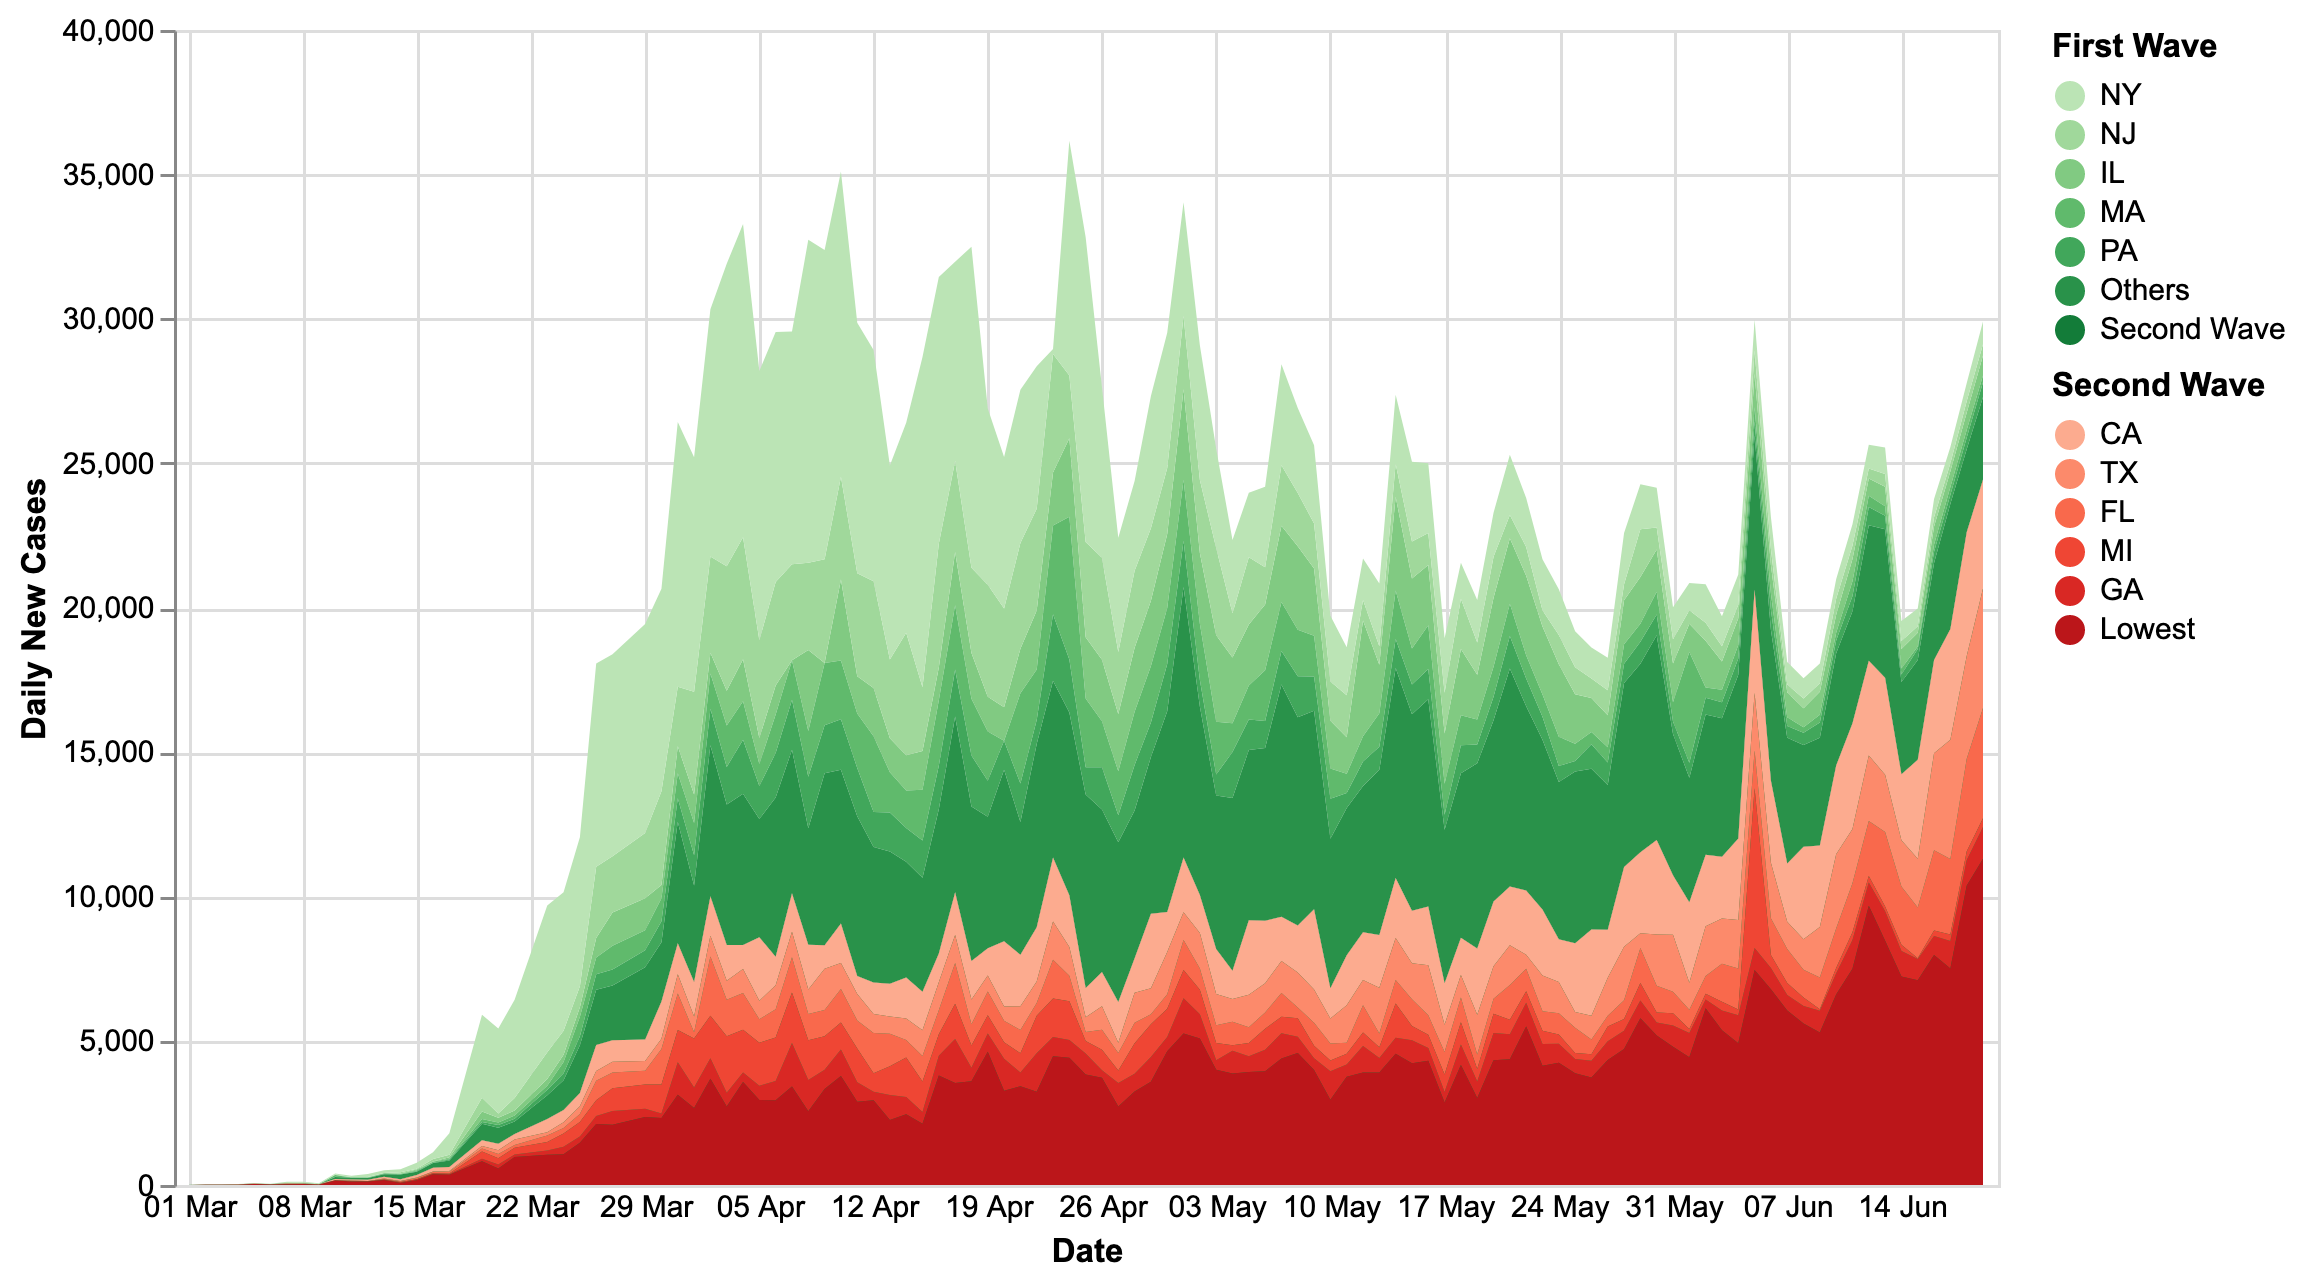](https://ratreya.github.io/COVID-19/wave.html)
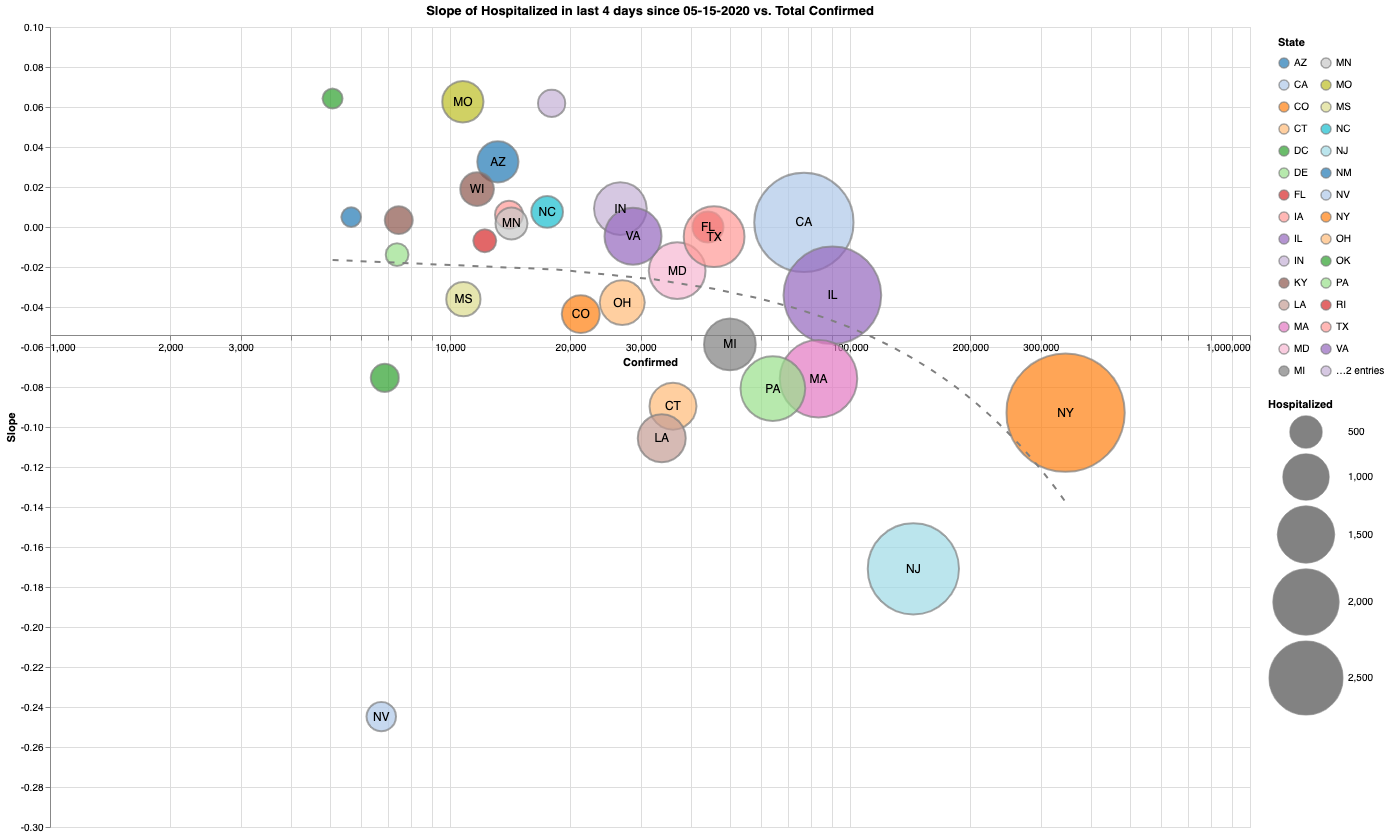
## Comparing various trends against total confirmed cases.
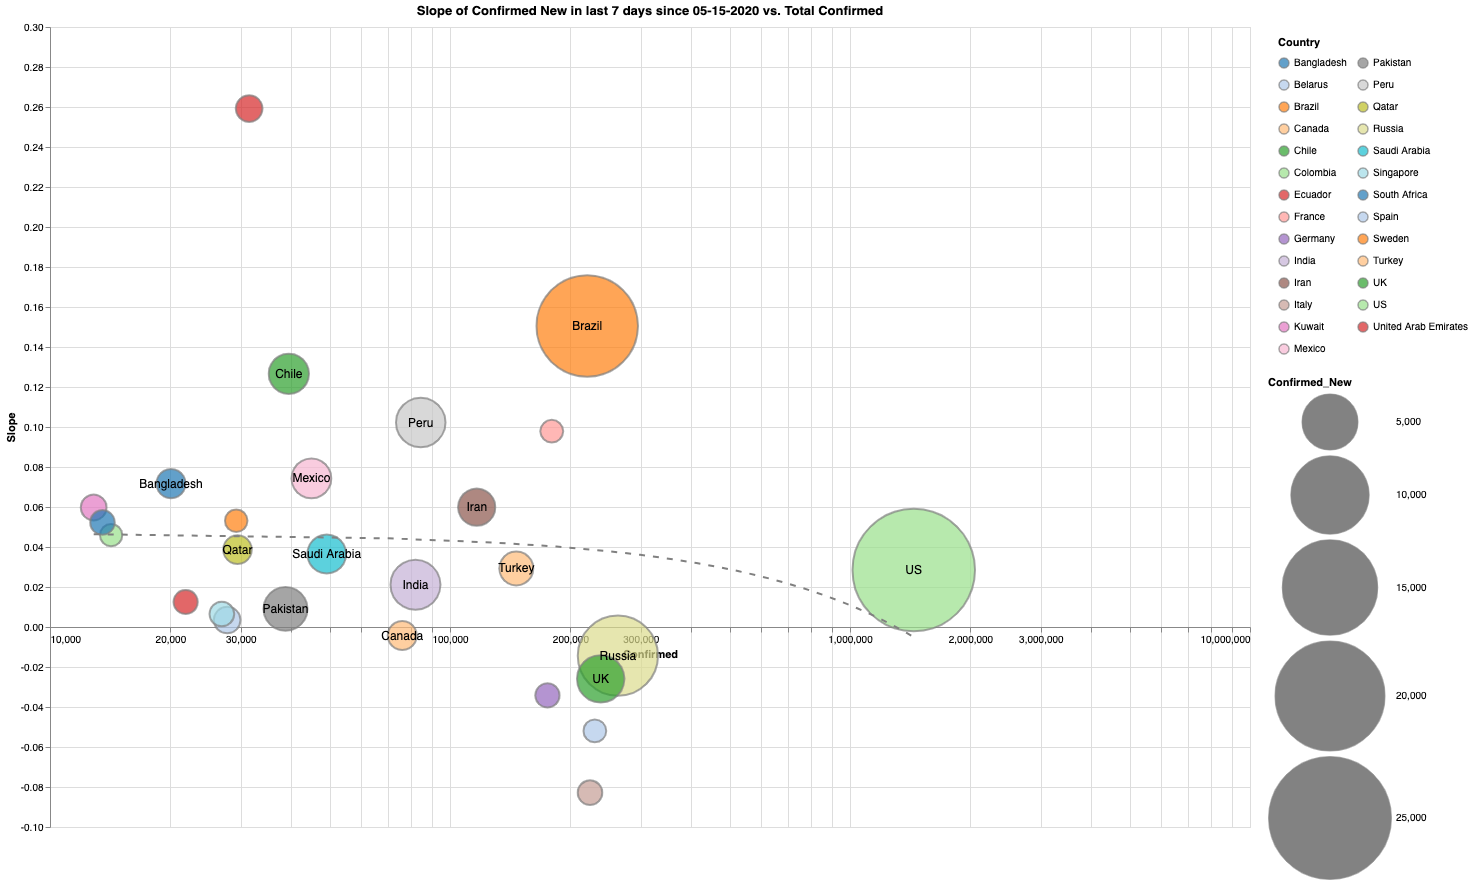
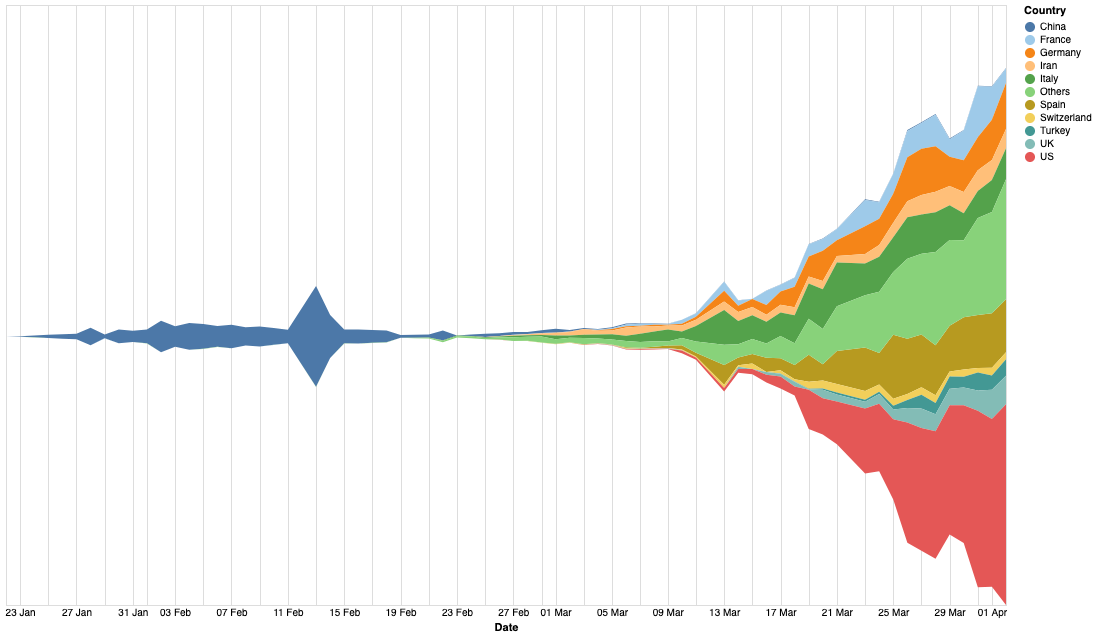
## World-wide daily new cases broken up by top 10 contributing countries.
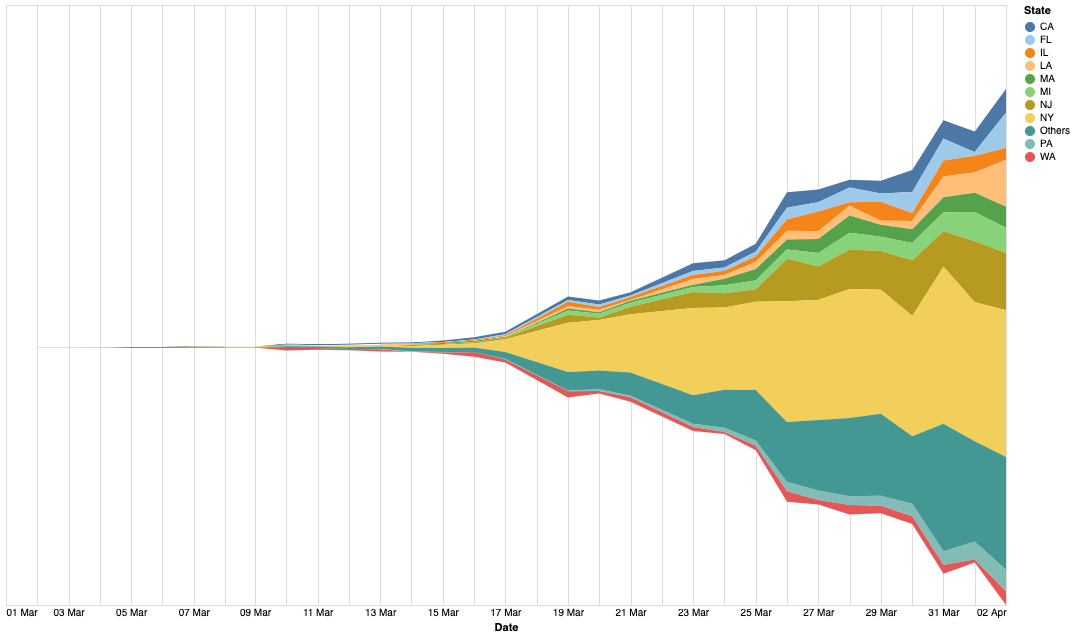
## US daily new cases broken up by top 10 contributing states.
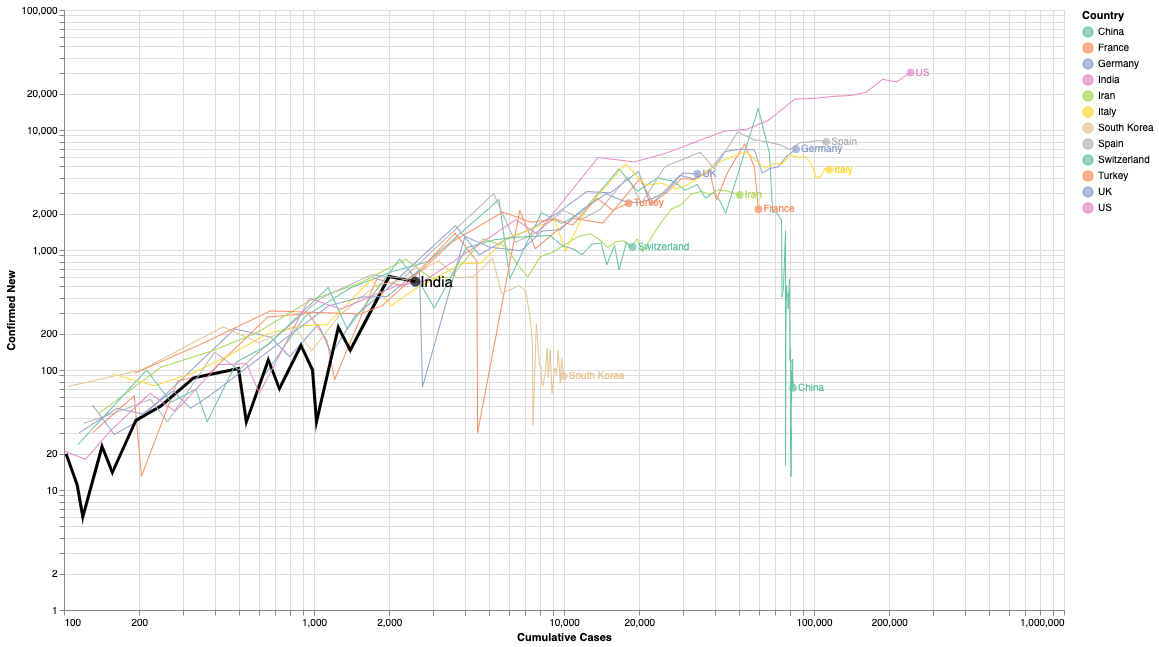
## Comparing New Case growth in India against other leading countries.
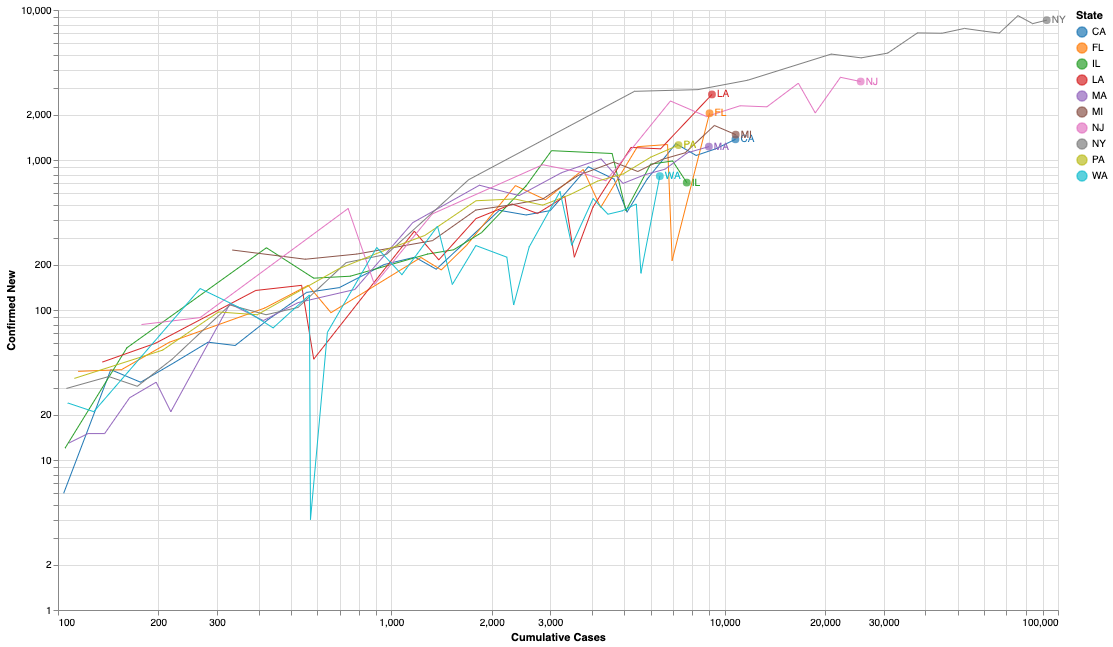
Comparing New Case growth of top 10 US states against each other.